

1 材料与方法
1.1 试验材料
1.2 试验动物及分组
1.3 样品采集及指标测定
1.3.1 样品采集
1.3.2 空肠组织中免疫球蛋白和细胞因子含量测定
1.3.3 血清非靶向代谢组学分析
1.4 数据处理与分析
2 结果与分析
2.1 灌胃罗伊氏乳杆菌I5007对大鼠增重的影响
表1 灌胃罗伊氏乳杆菌I5007对大鼠增重的影响Table 1 Effects of gavage of Lactobacillus reuteri I5007 on weight gain of rats |
| 项目 Items | 试验A组 Test group A | 试验B组 Test group B | 对照组 Control group | P值 P-value |
|---|---|---|---|---|
| 初始体重IBW/g | 72.24±2.62 | 72.87±4.75 | 73.77±3.36 | 0.610 |
| 终末体重FBW/g | 172.61±6.32ABab | 180.79±10.05Aa | 165.48±7.11Bb | 0.005 |
| 平均日增重ADG/(g/d) | 3.33±0.38ABa | 3.60±0.22Aa | 2.96±0.40Bb | 0.005 |
同行数据肩标相同小写字母或无字母表示差异不显著(P>0.05),不同小写字母表示差异显著(P<0.05),不同大写字母表示差异极显著(P<0.01)。下表同。 | |
In the same row, values with no letter or the same small letter superscripts mean no significant difference (P>0.05), while with different small letter superscripts mean significant difference (P<0.05), and with different capital letter superscripts mean extremely significant difference (P<0.01). The same as below. |
2.2 灌胃罗伊氏乳杆菌I5007对大鼠消化器官的影响
表2 灌胃罗伊氏乳杆菌I5007对大鼠小肠长度及肝脏指数的影响Table 2 Effects of gavage of Lactobacillus reuteri I5007 on small intestine length and liver index of rats |
| 项目 Items | 试验A组 Test group A | 试验B组 Test group B | 对照组 Control group | P值 P-value |
|---|---|---|---|---|
| 小肠长度Small intestine length/cm | 139.73±8.18a | 130.94±4.75b | 141.57±9.35a | 0.030 |
| 肝脏指数Liver index/% | 7.89±0.91Ba | 7.69±0.59Ba | 9.61±1.33Aa | 0.002 |
2.3 灌胃罗伊氏乳杆菌I5007对大鼠空肠组织中免疫球蛋白及细胞因子含量的影响
表3 灌胃罗伊氏乳杆菌I5007对大鼠空肠组织中免疫球蛋白及细胞因子含量的影响Table 3 Effects of gavage of Lactobacillus reuteri I5007 on immunoglobulin and cytokine contents in jejunum tissue of rats |
| 项目 Items | 试验A组 Test group A | 试验B组 Test group B | 对照组 Control group | P值 P-value |
|---|---|---|---|---|
| 免疫球蛋白Immunoglobulins/(μg/mg prot) | ||||
| 免疫球蛋白G IgG | 1.46±0.22 | 1.46±0.28 | 1.42±0.36 | 0.980 |
| 免疫球蛋白M IgM | 2 182.90±116.61Aa | 1 748.77±126.23BCbc | 1 569.09±164.83Cc | 0.004 |
| 分泌型免疫蛋白A sIgA | 5.24±0.41 | 5.53±1.00 | 4.92±0.52 | 0.470 |
| 细胞因子Cytokines/(pg/mg prot) | ||||
| 白细胞介素-2 IL-2 | 82.35±17.35 | 81.84±25.61 | 85.94±14.79 | 0.940 |
| 白细胞介素-3 IL-3 | 13.01±2.73 | 14.32±3.66 | 14.18±3.18 | 0.790 |
| 白细胞介素-6 IL-6 | 13.55±2.99 | 14.58±3.24 | 15.88±2.29 | 0.490 |
| 白细胞介素-1α IL-1α | 184.22±30.93Bb | 173.79±27.00Bb | 90.10±16.55Aa | 0.003 |
| 白细胞介素-1β IL-1β | 129.37±22.57 | 144.33±44.51 | 115.45±36.95 | 0.520 |
| 肿瘤坏死因子-α TNF-α | 133.00±8.83 | 137.64±13.99 | 132.76±13.92 | 0.090 |
2.4 灌胃罗伊氏乳杆菌I5007对大鼠血清代谢物的影响
2.4.1 样品质控(QC)与主成分分析(PCA)
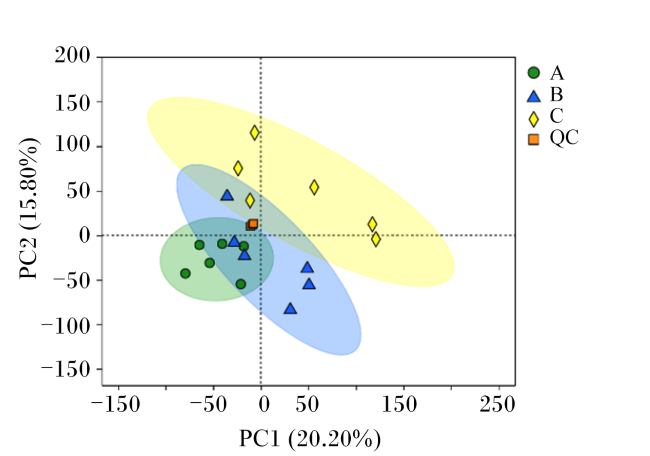
图1 血清代谢物的PCA得分图PC1:排名第1的主成分的得分;PC2:排名第2的主成分的得分。散点颜色表示样本的分组,椭圆表示95%置信区间。图中A、B、C和QC分别为试验A组、试验B组、对照组和质控样本,下图同。 Fig.1 PCA score plot of serum metabolites PC1: score of the first-ranked principal component; PC2: score of the second-ranked principal component. The scatter color indicates the grouping of samples, and the ellipse indicates the 95% confidence interval. In the figure, A, B and C are test group A, test group B, control group and quality control sample, respectively, the same as below. |
2.4.2 多变量统计分析
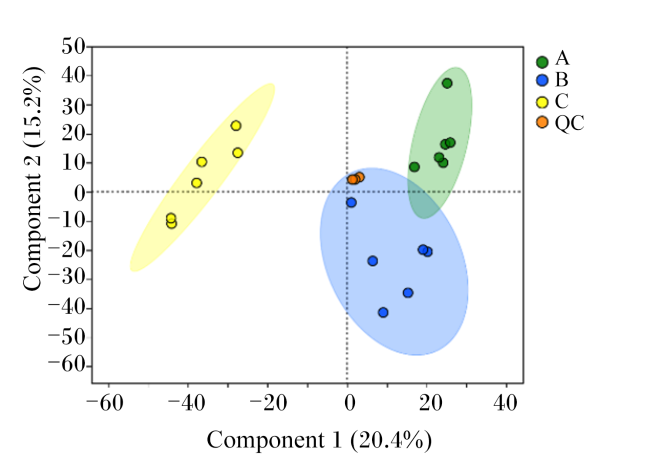
图2 血清代谢物的PLS-DA得分图Component 1:第1主成分解释度;Component 2:第2主成分解释度。坐标点的距离代表了样本间聚集和离散程度,距离越近表明样本间相似性越高,距离越远表明样本间差异性越大。 Fig.2 PLS-DA score plot of serum metabolites Component 1: the first principal component interpretation; Component 2: the second principal component interpretation. The distance of coordinate points represents the degree of aggregation and dispersion between samples. The closer the distance is, the higher the similarity between samples is. The farther the distance is, the greater the difference between samples is. |
2.4.3 差异代谢物的筛选及鉴定
2.4.3.1 差异代谢物筛选结果
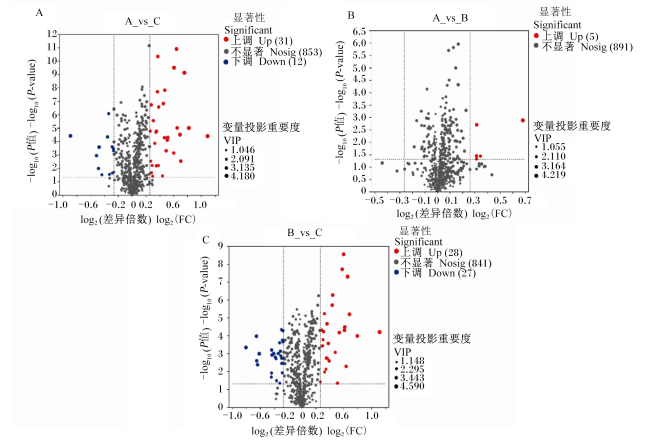
图3 组间差异代谢物火山图横坐标“log2(差异倍数)”为代谢物在2组间表达差异的倍数变化值,纵坐标“-log10(P值)”为代谢物在2组间表达差异的统计学检验值,该值越高则表达差异越显著。图中每1个点代表1个特定的代谢物,点的大小表示VIP值的大小。红色点表示显著上调的代谢物,蓝色表示显著下调的代谢物,灰色点为非显著差异代谢物。 Fig.3 Volcano plot of differential metabolites between groups The abscissa “log2(FC)” is the fold change of the difference in the expression of metabolites between the two groups, and the ordinate “-log10(P-value)” is the statistical test value of the difference in the expression of metabolites between the two groups, and the higher the value, the more significant the difference in expression. Each dot represents a specific metabolite, and the size of the dot indicates the VIP value. The red dots indicate significantly up-regulated metabolites, the blue dots indicate significantly down-regulated metabolites, and the gray dots indicate non-significantly different metabolites. |
表4 部分组间差异代谢物Table 4 Some differential metabolites between groups |
| 项目 Items | 差异代谢物 Differential metabolites | 趋势 Tendency | |||
|---|---|---|---|---|---|
| 试验A组vs对照组 Test group A vs control group | 4-羟基维甲酸 | 显著上调 | |||
| 1-甲基-3-(2-氧代亚丙基)吲哚-2-酮 | 显著上调 | ||||
| 雌二醇 | 显著上调 | ||||
| 甘氨酸 | 显著下调 | ||||
| 石胆酸甘氨酸结合物 | 显著下调 | ||||
| 四氢皮质酮 | 显著上调 | ||||
| 4-羟基-5-[4-羟基-3-(磺酰氧基)]戊酸 | 显著上调 | ||||
| L-色氨酸 | 显著下调 | ||||
| N-月桂酰苏氨酸 | 显著上调 | ||||
| 黄嘌呤 | 显著上调 | ||||
试验B组vs对照组 Test group B vs control group | 4-羟基维甲酸 | 显著上调 | |||
| 1-甲基-3-(2-氧代亚丙基)吲哚-2-酮 | 显著上调 | ||||
| 雌二醇 | 显著上调 | ||||
| 甘氨酸 | 显著下调 | ||||
| 四氢皮质酮 | 显著上调 | ||||
| 3,7-二羟基-12-氧代胆酸 | 显著上调 | ||||
| 3,7-二羟基胆烷-24-酸 | 显著上调 | ||||
| 7-酮脱氧胆酸 | 显著上调 | ||||
| N-月桂酰苏氨酸 | 显著上调 | ||||
| 亮氨酰脯氨酸 | 显著下调 |
2.4.3.2 典型的差异代谢物统计分析
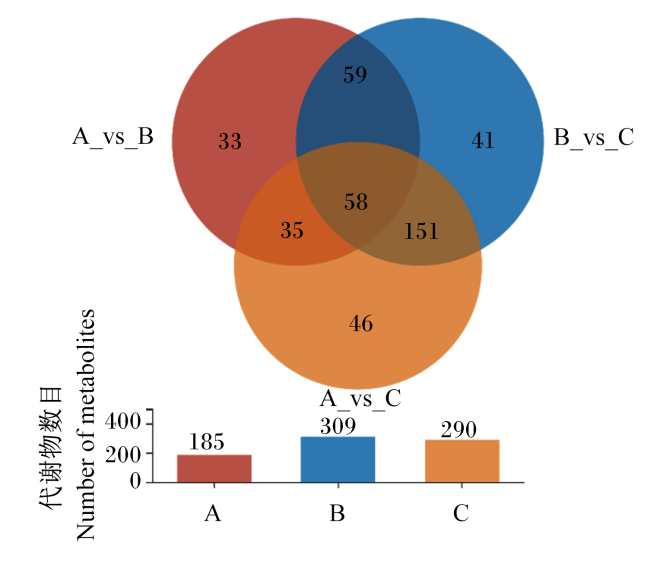
图4 差异代谢物韦恩图不同的颜色代表不同的分组,重叠部分的数字代表多个对比组中共有的代谢物数目,非重叠部分的数字代表对应对比组所特有的代谢物数目。 Fig.4 Venn diagram of differential metabolites The different colors represent the different groups, the numbers in the overlapping areas represent the number of metabolites common to multiple contrast groups, and the numbers in the non-overlapping areas represent the number of metabolites unique to the corresponding contrast group. |
表5 部分差异代谢物的相关通路Table 5 Related pathways of some differential metabolites |
| 项目 Items | 编号 ID | 差异代谢物 Differential metabolites | 通路 Pathways |
|---|---|---|---|
| 试验A组vs对照组 Test group A vs control group | pos_1 | 甘胆酸 | 胆固醇代谢 |
| pos_1970 | 犬尿酸 | 色氨酸代谢 | |
| pos_5297 | 溶血磷脂酰胆碱 | 甘油磷脂代谢;癌症中的胆碱代谢 | |
| pos_60 | 羟基苯乙酰甘氨酸 | 酪氨酸代谢 | |
| pos_6855 | 尿酸 | 胆汁分泌;嘌呤代谢 | |
| pos_7209 | 烟酰胺 | 烟酸和烟酰胺代谢;维生素的消化和吸收 | |
| pos_7315 | L-苏氨酸 | 氨基酸的生物合成 | |
| pos_7346 | 异丙肾上腺素 | 甘氨酸、丝氨酸和苏氨酸代谢 | |
| neg_3601 | 肉豆蔻酸 | 脂肪酸生物合成 | |
| neg_5027 | SM[d18∶1/24∶1(15Z)] | 鞘脂代谢 | |
| neg_1316 | 苹果酸 | 柠檬酸循环 | |
| 试验B组vs对照组 Test group B vs control group | pos_1109 | 磷脂酰胆碱 | 甘油磷脂代谢;花生四烯酸代谢 |
| pos_1241 | L-哌可酸 | 赖氨酸降解 | |
| pos_1421 | 丁酸 | 蛋白质消化吸收 | |
| pos_1625 | 左旋肉碱 | 胆汁分泌 | |
| pos_431 | 鸟氨酸 | 精氨酸生物合成;ABC转运蛋白 | |
| pos_6041 | 皮质酮 | 脂肪细胞脂解的调节;类固醇激素生物合成 | |
| pos_6911 | N2乙酰鸟氨酸 | 氨基酸的生物合成 | |
| pos_7564 | 肌苷酸 | 嘌呤代谢 | |
| neg_3265 | 磷脂酰乙醇胺 | 甘油磷脂代谢 | |
| neg_711 | 3-[4-甲氧基-3- (磺基)苯基]丙酸 | 苯丙氨酸、酪氨酸和 色氨酸生物合成;果糖和甘露糖代谢 |
2.4.4 差异代谢物KEGG通路富集分析
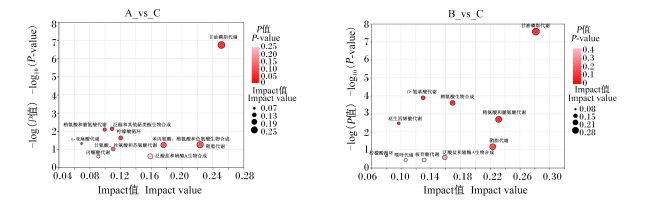


图5 灌胃罗伊氏乳杆菌I5007后优势代谢物KEGG拓扑分析图图中每1个气泡表示1个KEGG通路;横坐标“Impact值”表示代谢物在通路中的相对重要性的大小;纵坐标“-log10(P值)”表示代谢物参与通路的富集显著性;气泡大小代表Impact值;气泡越大,表示通路重要性越大;气泡越红,表示差异越显著。 Fig.5 Topological analysis diagram of KEGG for dominant metabolites after gavage of Lactobacillus reuteri I5007 Each bubble represents a KEGG pathway; the abscissa “Impact value” indicates the relative importance of the metabolite in the pathway; and the ordinate “-log10(P-value)” indicates the enrichment significance of the metabolite in the pathway. Bubble size represents the Impact value; the larger the bubble, the greater the importance of the pathway; the redder the bubble, the more significant the difference. |
表6 灌胃罗伊氏乳杆菌I5007后部分显著富集代谢通路及其对应的差异代谢物Table 6 Some significant enrichment of metabolic pathways and their corresponding differential metabolites after gavage of Lactobacillus reuteri I5007 |
| 项目 Items | 代谢途径 Metabolic pathways | 差异代谢物 Differential metabolites | 趋势 Tendency |
|---|---|---|---|
| 试验A组vs对照组 Test group A vs control group | 甘油磷脂代谢 | 磷脂酰胆碱 | 显著上调 |
| 鞘脂代谢 | C16神经酰胺 | 显著下调 | |
| 苯丙氨酸、酪氨酸和色氨酸生物合成 | 3-脱氢奎宁酸 | 显著上调 | |
| 泛酸盐和辅酶A生物合成 | 泛酸 | 显著上调 | |
| 柠檬酸循环 | 苹果酸 | 显著上调 | |
| 试验B组vs对照组 Test group B vs control group | 甘油磷脂代谢 | 磷脂酰乙醇胺 | 显著上调 |
| 精氨酸和脯氨酸代谢 | 4-胍基丁酸 | 显著上调 | |
| 鞘脂代谢 | C16-神经酰胺 | 显著下调 | |
| 泛酸盐和辅酶A生物合成 | 泛酸 | 显著上调 | |
| 核苷酸代谢 | 肌苷酸 | 显著下调 |