

1 材料与方法
1.1 试验设计与动物管理
表1 精料补充料组成及营养水平(干物质基础)Table 1 Composition and nutrient levels of the concentrate supplement (DM basis) % |
| 项目Items | 含量Content |
|---|---|
| 原料Ingredients | |
| 玉米Corn | 53.00 |
| 豆粕Soybean meal | 10.00 |
| 棉籽粕Cottonseed meal | 15.00 |
| 小麦麸Wheat bran | 15.00 |
| 食盐NaCl | 1.00 |
| 磷酸氢钙CaHPO4 | 1.00 |
| 石粉Limestone | 1.00 |
| 预混料Premix1) | 4.00 |
| 合计Total | 100.00 |
| 营养水平Nutrient levels2) | |
| 代谢能ME/(MJ/kg) | 9.83 |
| 粗蛋白质CP | 12.60 |
| 中性洗涤纤维NDF | 36.20 |
| 酸性洗涤纤维ADF | 21.40 |
| 粗脂肪EE | 3.96 |
1)预混料为每千克精料补充料提供 The premix provided the following per kg of the concentrate supplement:VA 2 560 IU,VD 3 550 IU,VE 20 mg,Fe (as ferrous sulfate) 61 mg,Cu (as copper sulfate) 18 mg,Zn (as zinc sulfate) 49 mg,Mn (as manganese sulfate) 47 mg,Co 0.12 mg,I (as potassium iodide) 0.31 mg,Se (as sodium selenite) 0.36 mg。 |
1.2 样品采集
1.3 指标测定
1.3.1 背膘厚
1.3.2 饲粮营养成分
1.3.3 瘤胃发酵指标
1.3.4 DNA提取与测序
1.3.5 生物信息学分析
1.4 统计分析
2 结果与分析
2.1 不同背膘厚秦川牛的瘤胃发酵指标差异
表2 不同背膘厚秦川牛的瘤胃发酵指标差异Table 2 Differences of rumen fermentation indices of Qinchuan cattle with different backfat thickness |
| 项目 Items | 组别Groups | 均值标准误 SEM | P值 P-value | |
|---|---|---|---|---|
| H-BFT | L-BFT | |||
| 氨态氮NH3-N/(mmol/L) | 3.47 | 3.45 | 0.332 | 0.977 |
| 乙酸Acetate/(mmol/L) | 114.63a | 89.57b | 3.310 | <0.001 |
| 丙酸Propionate/(mmol/L) | 22.64 | 25.11 | 0.981 | 0.212 |
| 异丁酸Isobutyrate/(mmol/L) | 1.33 | 1.34 | 0.046 | 0.921 |
| 丁酸Butyrate/(mmol/L) | 13.81a | 11.33b | 0.501 | 0.034 |
| 异戊酸Isovalerate/(mmol/L) | 1.66 | 2.01 | 0.124 | 0.153 |
| 戊酸Valerate/(mmol/L) | 1.27 | 1.48 | 0.114 | 0.376 |
| 总挥发性脂肪酸TVFAs/(mmol/L) | 154.89a | 130.85b | 4.112 | 0.002 |
| 乙酸/丙酸Acetate/propionate | 5.38a | 3.66b | 0.263 | <0.001 |
同行数据肩标无字母表示差异不显著(P>0.05),不同小写字母表示差异显著(P<0.05)。 | |
In the same row, values with no letter superscripts mean no significant difference (P>0.05), while with different small letter superscripts mean significant difference (P<0.05). |
2.2 瘤胃微生物多样性
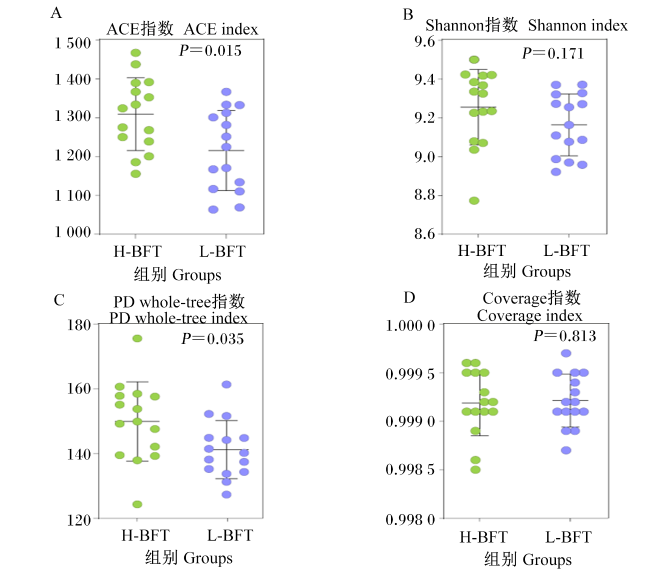
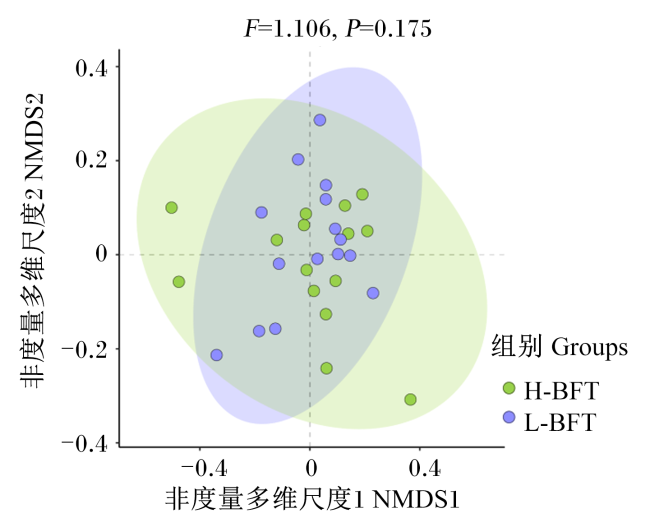
2.3 不同背膘厚秦川牛的瘤胃微生物组成差异
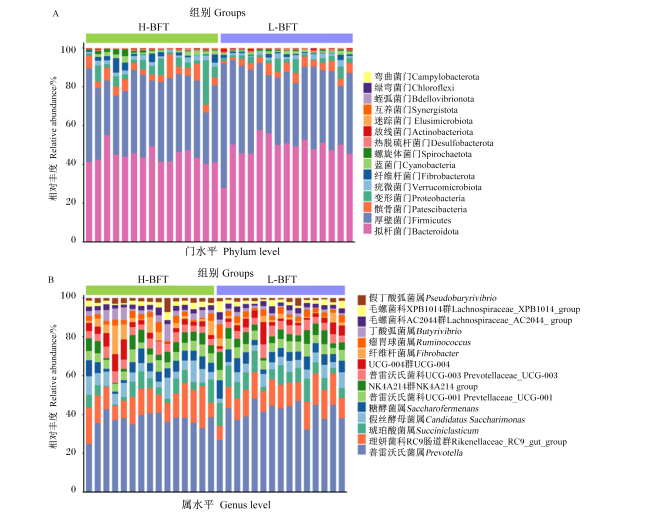
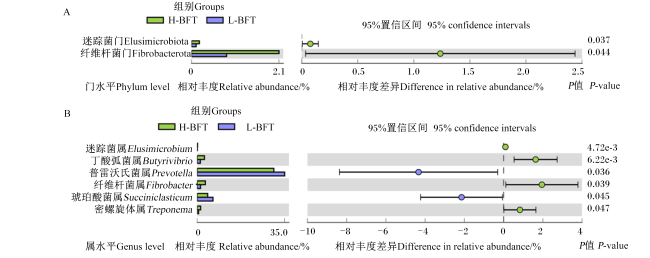
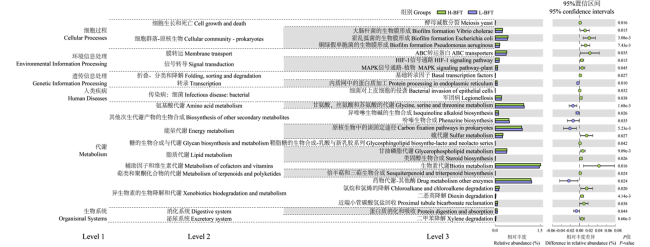
2.4 不同背膘厚秦川牛的瘤胃微生物KEGG功能预测
2.5 不同背膘厚秦川牛的瘤胃微生物共现网络
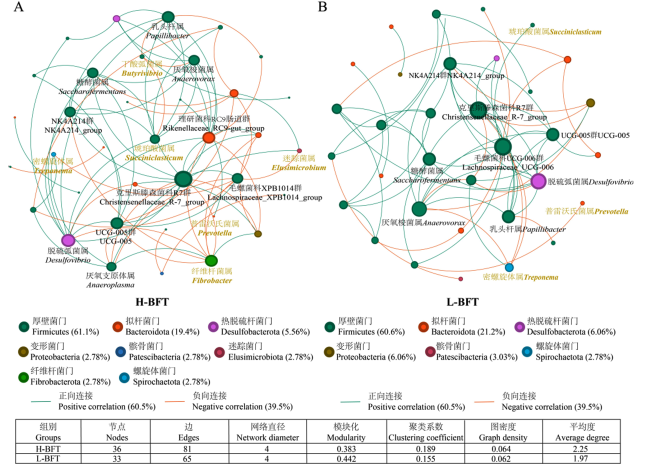
图6 不同背膘厚秦川牛的瘤胃微生物共现网络每个节点表示单个属,其大小与节点度呈正相关,颜色按门划分。节点间连线表示斯皮尔曼相关性系数|r|>0.6且P<0.05,其中绿色连线表示正向连接,橙色连线表示负向连接。仅显示组间差异显著的属和作为枢纽节点的属。底部的表格为共现网络的拓扑结构。 Fig.6 Co-occurrence network of rumen microbiota of Qinchuan cattle with different backfat thickness Each node represented a genus, with node size positively correlated with degree, and colors indicating different phyla. Edges between nodes represented Spearman correlations coefficients |r|>0.6 with P<0.05; green edges indicated positive correlations, while orange edges indicate negative correlations. Only genera with significant differences between groups and those serving as hub nodeswere shown. The table below displayed the topological characteristics of the co-occurrence networks. |
2.6 背膘厚与瘤胃发酵指标和微生物相关性分析
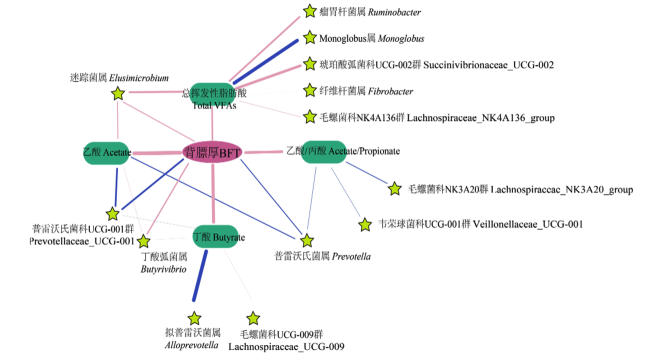


图7 背膘厚与瘤胃发酵指标和微生物的相关性网络绿色框为发酵性能指标,五角星代表属水平的瘤胃微生物。仅显示了基于斯皮尔曼相关性分析中相关性系数|r|>0.3且P<0.05节点及其连线。粉色连线表示正相关,蓝色连线表示负相关。 Fig.7 Correlation network between backfat thickness and rumen fermentation indices and microbiota The green boxes represented fermentation parameters, while pentagons represent rumen microbiota at the genus level. Only nodes and edges with Spearman correlation coefficients |r|>0.3 and P<0.05 were displayed. Pink edges indicated positive correlations, while blue edges indicated negative correlations. |