RESEARCH PAPER

Study on Feed Efficiency and Growth Development Characteristics of Multiparous Fine Wool Sheep at 80 to 160 Days of Age Based on Residual Feed Intake

  • WANG Xu , 1 ,
  • HANIKZ Tulav 2 ,
  • HUANG Juncheng 2 ,
  • LIU Wujun 1 ,
  • TAO Weikun 3 ,
  • LIN Changchun 1 ,
  • LI Pengfei 2 ,
  • DONG Guihua 1 ,
  • YAN Nana 1 ,
  • WANG Bo 1 ,
  • WU Weiwei , 2, * ,
  • ZHENG Wenxin , 1, *
Expand
  • 1 College of Animal Sciences, Xinjiang Agriculture University, Urumqi 830052, China
  • 2 Institute of Animal Science, Xinjiang Academy of Animal Husbandry Sciences, Urumqi 830011, China
  • 3 College of Animal Science and Technology, Shihezi University, Shihezi 832003, China
* WU Weiwei, professor, E-mail: ;
ZHENG Wenxin, professor, E-mail:

Received date: 2024-12-13

  Online published: 2025-09-12

Abstract

This study aimed to investigate the growth characteristics, feed efficiency, and residual feed intake (RFI) variations of multiparous fine wool sheep at 80 to 160 days of age, as well as the correlations among these parameters and to further compare the differences among multiparous fine wool sheep with different RFI. The experimental population consisted of 139 healthy multiparous fine wool sheep male lambs housed in standardized single pens. Sheep were only weaned at 56 days of age, and the experiment was divided into transition (14 d), pre-test (10 d), and test (80 d) periods. During the test period, feed intake was recorded daily to calculate average daily feed intake (ADFI), and body weight (BW) and body measurement data were recorded every 20 days to calculate average daily gain (ADG) and feed conversion rate (FCR). According to the mean (80 to 160 days of age) and standard deviation (SD) of individual RFI, the experimental flocks were divided into three groups: high RIF group (RFI>mean+0.5SD, n=40), moderate RFI group (mean-0.5SD≤RFI≤mean+0.5SD, n=59) and low RFI group (RFI<mean-0.5SD, n=40). The results showed as follows: 1) during the age of 80 to 160 days, multiparous fine wool sheep exhibited an ADG of 0.30 kg, a FCR of 5.11, an ADFI of 1.53 kg, and a metabolic body weight (MBW) of 13.18 kg. With increasing age, BW and body measurements increased gradually, while their coefficients of variation decreased progressively. 2) Traits such as BW, body length (BL), body height (BH), and chest circumference (ChC) all showed significant or extremely significant positive correlations with RFI within the corresponding age stages (P<0.05 or P<0.01). RFI was significant or extremely significant negative correlations with ADG and ADFI (P<0.05 or P<0.01), but showed no significant correlation with FCR (P>0.05). Additionally, cannon circumference (CaC) and scrotal circumference (SC) displayed high correlations with chest circumference (ChC) and body height (BH) at various age stages. 3) Group comparisons indicated that the low-RFI group had significantly lower RFI, ADFI, and FCR compared with the medium-RFI group (P<0.05), and the medium-RFI group had significantly lower values than the high-RFI group (P<0.05). Significant differences were observed among the groups for certain growth traits (e.g., BH, BL, ChC, and CaC; P<0.05), whereas no significant differences were detected in rump height, chest width, hip width, and scrotal circumference (P>0.05). In conclusion, compared with the traditional FCR, RFI as an evaluation index can not only more accurately reflect feed efficiency, but also help to rationally regulate animal feed intake. However, the feeding behavior of animals is affected by multiple factors such as environmental factors, individual physiological characteristics, and diet quality, so it is necessary to comprehensively consider the mechanism of these factors on feed intake in practical applications.

Cite this article

WANG Xu , HANIKZ Tulav , HUANG Juncheng , LIU Wujun , TAO Weikun , LIN Changchun , LI Pengfei , DONG Guihua , YAN Nana , WANG Bo , WU Weiwei , ZHENG Wenxin . Study on Feed Efficiency and Growth Development Characteristics of Multiparous Fine Wool Sheep at 80 to 160 Days of Age Based on Residual Feed Intake[J]. Chinese Journal of Animal Nutrition, 2025 , 37(9) : 6061 -6071 . DOI: 10.12418/CJAN2025.493

随着国内养羊业逐步向规模化、集成化方向发展,饲粮消耗已成为主要成本之一。饲料效率(FE)是评估饲粮利用效率的重要指标,而低FE不仅会显著增加生产成本,还可能对环境带来负面影响[1-3]。因此,提高FE对于降低经济成本和减轻环境压力具有重要意义。现有研究中,FE可通过多种指标进行衡量,包括饲料转化率(FCR)、相对生长率、克莱伯速率、剩余体重增重(RG)和剩余采食量(RFI)[4]。其中,FCR作为传统的评估方法存在一定的统计学和生物学局限性[5-7];Koch等[8]于1963年首次提出了RFI的概念,用于研究动物在饲粮转化为身体组织方面的差异。RFI被定义为个体实际采食量与基于其体型和生产性能预测采食量之间的差值,体现为回归模型中的残差部分[9]。RFI作为一种更能独立反映个体间代谢效率差异的指标[10-11],已被广泛应用于畜禽FE的研究,并在降低饲粮消耗[12-13]和减少温室气体排放方面表现出潜在优势[14-17]。在羊的生产中,通过利用RFI评估FE能够更加客观地识别高效与低效个体。此外,RFI在羊群中的应用研究正不断深入,涵盖采食行为与饮水模式[18]、肠道微生物群[19]、代谢调控[20]等多个方面。基于此,本研究以育肥期多胎型细毛羊公羔为对象,探究其在80~160日龄的FE与生长发育规律,并通过对不同RFI个体的FE差异进行分析,为多胎型细毛羊FE的改良和优化提供科学依据。

1 材料与方法

1.1 试验动物及饲养管理

试验所用羊均来自新疆维吾尔自治区阿克苏市拜城县兴科牧业有限公司。试验经过新疆畜牧科学院畜牧研究所协议管理与审查委员会批准(动伦2024第08号)。试验群体由139只出生日期接近、健康无病的多胎细毛羊公羔组成,并采用标准化单栏饲养方式。
试验羊于56日龄断奶,断奶后进入单栏饲养。试验分为3个阶段:过渡期(14 d)、预试期(10 d)和正试期(80 d),正试期分为4个阶段,每阶段20 d。过渡期内,饲喂羔羊全价颗粒料,每天按比例增加7.14%,直至完全替换为全价颗粒料。预试期与正试期内,所有羊均自由采食全价颗粒料,且可自由饮水。
在正试期,每天早晨收集羊未采食的颗粒料并称重记录。在正试期的第1、20、40、60和80天晨饲前,对羊进行空腹体重称量。此外,每只羊及其单栏环境每月进行驱虫与消毒。整个试验过程中,试验羊健康状况良好,无疾病发生。

1.2 基础饲粮

基础饲粮为颗粒料,参考《肉羊饲养标准》(NY/T 816—2004)配制,其组成及营养水平见表1。饲粮的干物质(DM)含量参考GB/T 6435—2014的方法进行测定;粗蛋白质(CP)含量参考GB/T 6432—2018的方法进行测定;粗脂肪(EE)含量参考GB/T 6433—2006的方法进行测定;粗灰分(Ash)含量参考GB/T 6438—2007的方法进行测定;钙(Ca)含量参考GB/T 13885—2017的方法进行测定;磷(P)含量参考GB/T 6437—2018的方法进行测定;中性洗涤纤维(NDF)含量参考GB/T 20806—2022的方法进行测定;酸性洗涤纤维(ADF)含量参考NY/T 1459—2022的方法进行测定。代谢能参考《肉羊饲养标准》(NY/T 816—2021)[21]进行计算。
表1 基础饲粮组成及营养水平(风干基础)

Table 1 Composition and nutrient levels of the basal diet (air-dry basis) %

项目Items 含量Content
原料Ingredients
玉米秸秆Corn stover 13.40
苜蓿粉Alfalfa powder 14.35
豆粕Soybean meal 11.48
棉籽粕Cottonseed meal 12.44
玉米Corn 38.00
面粉Flour 6.70
石粉Limestone 1.00
碳酸氢钙Ca(HCO3)2 0.19
碳酸氢钠NaHCO3 0.77
食盐NaCl 1.00
预混料Premix1) 0.67
合计Total 100.00
营养水平Nutrient levels2)
干物质DM 87.10
粗蛋白质CP 16.17
粗脂肪EE 1.83
粗灰分Ash 11.65
中性洗涤纤维NDF 36.89
酸性洗涤纤维ADF 29.85
钙Ca 0.69
磷P 0.39
代谢能ME/(MJ/kg) 10.08

1)每千克预混料含有One kilogram of premix contained the following:VA 150 000 IU,VD3 56 500 IU,VE 8 000 IU,Se (as sodium selenite) 14 mg,I (as potassium iodide) 80 mg,Cu (as copper sulfate) 290 mg,Mn (as manganese sulfate) 1 925 mg,Zn (as zinc oxide) 2 050 mg,Co (as cobalt sulfate) 24 mg。

2)代谢能为计算值,其他为测定值。ME was a calculated value,while the others were measured values.

1.3 FE相关性状、生长性状及测定方法

1.3.1 性状测定类别

FE相关性状包括:平均日采食量(ADFI)、代谢体重(MBW)、FCR、RFI;生长性状包括:体重(BW)、平均日增重(ADG)、体高(BH)、体长(BL)、胸围(ChC)、管围(CaC)、十字部高(WH)、胸深(CD)、胸宽(CW)、腰角宽(HW)、阴囊围(SC)。

1.3.2 测定方法

使用电子台秤称量每只羔羊80、100、120、140、160日龄时的BW,记录时保留小数点后2位。
用卷尺等测量工具测量羔羊的BL、BH、WH、ChC、CaC、HW、CW、CD、SC的数值,其中BL:肩端到臀部的直线距离;BH:髻甲最高点到地面的垂直距离;ChC:沿肩甲软骨的后缘量取胸部的垂直周径;CaC:左前肢管部最细处的周径;WH:髋骨的突起点到地面的垂直距离;HW:骨盆最宽处的水平距离;CW:前胸两侧最宽处之间的水平距离;CD:背部到胸部最深处的垂直距离;SC:阴囊最宽处的周长。
相关计算公式如下:
ADG=(末体重-初体重)/测定天数;
ADFI=投入饲粮-剩余饲粮;
FCR=ADFI/ADG。
采用Koch等[8]提出的基于ADG、MBW及ADFI参数使用R 4.3.2软件构建回归方程的方法来计算多胎细毛羊个体的RFI,涉及模型为:
Yi=β0+β1(ADGi)+β2MBWi+ei
式中:Yi代表多胎细毛羊个体i实际的DM采食量;β0代表回归截距;ADGi是多胎细毛羊个体i的ADG;β1是一个表示ADG对个体采食量影响程度的固定值;β2也是一个固定值,代表平均中期MBW对采食量的影响程度;ei是多胎细毛羊个体i的RFI,是该个体的实际采食量与预期采食量的差值。
模型中ADG由以下公式计算:
ADGi=(FBWi-IBWi)/N
式中:FBWi是多胎细毛羊个体i的试验末体重;IBWi是个体i的试验初体重;N是试验天数。
模型中平均中期MBW则由以下公式计算:
MBWi=[1/2×(FBWi+IBWi)]0.75

1.4 不同RFI组间比较

根据1.3.2中计算的个体全期RFI(80~160日龄)的平均值和标准差(SD)将试验羊群分为3组,分别为高RFI组(RFI>平均值+0.5SD,40只)、中RFI组(平均值-0.5SD≤RFI≤平均值+0.5SD,59只)和低RFI组(RFI<平均值-0.5SD,40只),比较3组间FE相关性状、生长性状的差异。

1.5 数据统计分析

80~160日龄各阶段试验羊的BW、ADG、ADFI、MBW、FCR和RFI等性状的平均值、标准差、变异系数、最大值和最小值均由R 4.3.2软件统计得出。不同RFI组羔羊的FE相关性状、生长性状的比较分析利用R 4.3.2软件的one-way ANOVA程序进行非参数检验,之后使用LSD法进行多重比较。P<0.05为差异显著,0.05≤P<0.10为差异有显著性趋势。

2 结果与分析

2.1 FE相关性状描述性统计及其变化规律

表2所示,各日龄阶段ADFI呈逐渐增加趋势,其变异系数介于6.25%~13.37%,表明采食量的个体差异整体较为稳定,但在后期有所增加。ADG在不同日龄阶段相对稳定,80~100日龄为0.31 kg,101~120日龄下降至0.30 kg,141~160日龄再次回升至0.31 kg。ADG的变异系数相对较高,尤其是在101~120日龄达到23.33%,反映个体间生长速度存在显著差异。FCR在整个生长阶段表现出一定波动,从80~100日龄的4.35逐渐上升至121~140日龄的5.84,随后在141~160日龄略微下降至5.48。FCR的变异系数介于17.64%~22.30%,表明个体间在FE上的差异显著。MBW随着生长阶段的推进逐步增加,从80~100日龄的12.04 kg增长至141~160日龄的18.09 kg,其变异系数在11.28%~12.90%,说明个体间MBW的差异相对较小且稳定。
表2 FE相关性状的描述性统计量

Table 2 Descriptive statistics of FE-related traits

项目
Items
平均值±标准差
Mean±SD
最大值
Max value
最小值
Min value
变异系数
CV/%
平均日采食量ADFI/kg
80~100日龄80 to 100 days of age 1.28±0.08 1.55 1.04 6.25
101~120日龄101 to 120 days of age 1.49±0.13 1.80 1.07 8.72
121~140日龄121 to 140 days of age 1.59±0.14 1.87 1.17 8.81
141~160日龄141 to 160 days of age 1.72±0.23 2.30 1.04 13.37
80~160日龄80 to 160 days of age 1.53±0.11 1.87 1.27 7.19
平均日增重ADG/kg
80~100日龄80 to 100 days of age 0.31±0.06 0.44 0.11 19.35
101~120日龄101 to 120 days of age 0.30±0.07 0.45 0.12 23.33
121~140日龄121 to 140 days of age 0.28±0.06 0.43 0.11 21.43
141~160日龄141 to 160 days of age 0.31±0.06 0.44 0.17 19.35
80~160日龄80 to 160 days of age 0.30±0.03 0.38 0.23 10.00
饲料转化率FCR
80~100日龄80 to 100 days of age 4.35±0.97 9.66 3.06 22.30
101~120日龄101 to 120 days of age 5.12±1.07 8.57 3.47 20.90
121~140日龄121 to 140 days of age 5.84±1.03 8.82 3.72 17.64
141~160日龄141 to 160 days of age 5.48±1.00 8.71 3.58 18.25
80~160日龄80 to 160 days of age 5.11±0.45 7.06 3.98 8.81
代谢体重MBW/kg
80~100日龄80 to 100 days of age 12.04±1.55 15.55 8.93 12.87
101~120日龄101 to 120 days of age 14.42±1.86 18.82 10.79 12.90
121~140日龄121 to 140 days of age 16.42±2.10 20.85 12.42 12.79
141~160日龄141 to 160 days of age 18.09±2.04 22.36 13.86 11.28
80~160日龄80 to 160 days of age 13.18±1.04 15.94 10.28 7.89
全期(80~160日龄)平均表现如下:ADG为0.30 kg,FCR为5.11,ADFI为1.53 kg,MBW为13.18 kg。

2.2 生长性状描述性统计及其变化规律

表3所示,各生长性状均随着日龄的增加而逐步提升。BW从80日龄的20.07 kg增长至160日龄的42.38 kg,BH从80日龄的56.72 cm增加至160日龄的66.40 cm。各体尺性状的变异系数表明,羊群在不同生长性状上的变异程度随生长阶段的变化而略有波动。BW的变异系数介于10.48%~12.49%,而HW的变异系数在7.19%~15.93%。这些数据反映了羊群在生长过程中个体间性状差异的动态变化。
表3 生长性状的描述性统计量

Table 3 Descriptive statistics of growth traits

项目
Items
平均值±标准差
Mean±SD
最大值
Max value
最小值
Min value
变异系数
CV/%
体重BW/kg
80日龄80 days of age 20.07±2.47 27.94 15.00 12.31
100日龄100 days of age 25.26±3.13 34.72 17.90 12.39
120日龄120 days of age 30.66±3.83 41.36 22.85 12.49
140日龄140 days of age 36.10±4.32 48.02 23.45 11.97
160日龄160 days of age 42.38±4.44 54.42 33.10 10.48
腰角宽HW/cm
80日龄80 days of age 13.50±2.15 19.00 9.60 15.93
100日龄100 days of age 14.82±2.08 19.00 11.00 14.04
120日龄120 days of age 15.44±1.11 20.00 12.50 7.19
140日龄140 days of age 16.26±1.54 20.60 12.80 9.47
160日龄160 days of age 17.41±1.43 21.00 14.00 8.21
体高BH/cm
80日龄80 days of age 56.72±3.72 68.00 48.40 6.56
100日龄100 days of age 59.38±2.87 68.00 53.00 4.83
120日龄120 days of age 62.77±3.83 73.60 55.90 6.10
140日龄140 days of age 63.83±3.10 74.10 55.20 4.86
160日龄160 days of age 66.40±3.64 75.00 56.40 5.48
十字部高WH/cm
80日龄80 days of age 56.09±3.37 64.40 49.90 6.01
100日龄100 days of age 58.63±2.78 66.00 53.80 4.74
120日龄120 days of age 61.68±2.53 67.60 55.00 4.10
140日龄140 days of age 63.99±2.91 70.80 56.50 4.55
160日龄160 days of age 66.78±2.86 74.40 60.10 4.28
体长BL/cm
80日龄80 days of age 55.67±3.64 67.20 46.80 6.54
100日龄100 days of age 60.57±3.12 69.40 53.00 5.15
120日龄120 days of age 66.09±3.80 76.50 56.00 5.75
140日龄140 days of age 72.29±4.51 85.10 62.20 6.24
160日龄160 days of age 76.93±5.03 89.70 66.80 6.54
胸宽CW/cm
80日龄80 days of age 14.63±1.76 19.80 10.20 12.03
100日龄100 days of age 17.10±1.32 19.80 13.80 7.72
120日龄120 days of age 18.28±1.36 21.10 14.00 7.44
140日龄140 days of age 18.48±1.51 21.20 14.40 8.17
160日龄160 days of age 19.32±1.44 21.80 15.40 7.45
胸围ChC/cm
80日龄80 days of age 63.67±6.51 79.50 53.50 10.22
100日龄100 days of age 68.51±4.20 84.00 60.00 6.13
120日龄120 days of age 74.92±6.18 91.50 63.80 8.25
140日龄140 days of age 76.34±5.64 91.20 65.20 7.39
160日龄160 days of age 80.63±5.62 92.00 69.40 6.97
胸深CD/cm
80日龄80 days of age 27.10±2.46 31.00 20.20 9.08
100日龄100 days of age 27.20±2.04 31.40 22.40 7.50
120日龄120 days of age 28.78±1.47 32.20 25.20 5.11
140日龄140 days of age 30.10±1.57 33.40 26.50 5.22
160日龄160 days of age 33.24±1.82 37.00 30.00 5.48
管围CaC/cm
80日龄80 days of age 8.33±0.71 9.00 7.00 8.52
100日龄100 days of age 8.54±0.58 9.50 7.50 6.79
120日龄120 days of age 8.62±0.68 10.00 7.50 7.89
140日龄140 days of age 8.91±0.73 11.00 7.50 8.19
160日龄160 days of age 9.35±0.88 11.50 7.72 9.41
阴囊围SC/cm
80日龄80 days of age 11.12±1.60 16.20 8.00 14.39
100日龄100 days of age 14.87±2.08 20.00 10.50 13.99
120日龄120 days of age 19.52±2.62 26.50 14.50 13.42
140日龄140 days of age 22.27±3.15 29.20 14.80 14.14
160日龄160 days of age 24.87±3.15 31.80 17.40 12.67

2.3 FE相关性状及生长性状的相关性分析

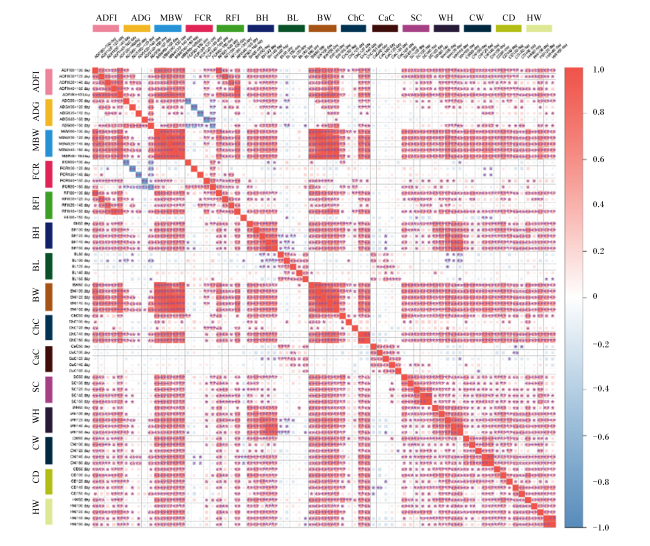
图1所示,BW、BL、BH和ChC等生长性状在各阶段中呈显著正相关(P<0.05),且相关系数多数接近于1,表明这些性状之间具有高度一致的增长趋势。RFI与ADG及ADFI呈显著或极显著负相关(P<0.05或P<0.01),与FCR无显著相关(P>0.05)。FCR与ADG在多个阶段呈显著或极显著负相关(P<0.05或P<0.01),显示FCR较低的个体通常具有更快的生长速度。此外,ADG在各阶段与BW、BL等主要生长性状呈显著或极显著正相关(P<0.05或P<0.01),反映了生长速度与BW和BL性状的紧密联系。MBW与BH和CW表现出极显著相关性(P<0.01),同时,CaC、SC等体尺性状在不同阶段与ChC和BH也呈现较高的相关性。
图1 FE相关性状及生长性状的相关性分析

ADFI:平均日采食量 average daily feed intake;ADG:平均日增重 average daily gain;MBW:代谢体重 metabolic body weight;FCR:饲料转化率 feed conversion ratio;RFI:剩余采食量 residual feed intake;BH:体高 body height;BL:体长 body length;BW:体重 body weight;ChC:胸围 chest circumference;CaC:管围 cannon circumference;SC:阴囊围 scrotal circumference;WH:十字部高 withers height;CW:胸宽 chest width;CD:胸深 chest depth;HW:腰角宽 hip width。

每个方块的大小表示相关系数的绝对值。红色和蓝色梯度分别表示正相关或负相关。**表示极显著相关(P≤0.01),*表示显著相关(P≤0.05)。The size of each block represents the absolute value of the correlation coefficient. The red and blue gradients indicate positive and negative correlations, respectively. ** indicates highly significant correlation (P≤0.01), and * indicates significant correlation (P≤0.05).

Fig.1 Correlation analysis of FE-related traits and growth traits

2.4 不同RFI多胎细毛羊FE相关性状和生长性状间比较分析

表4所示,全期RFI、全期ADFI以及全期FCR在各组间均呈现显著差异(P<0.05)。低RFI组的这些指标显著低于中RFI组(P<0.05),而中RFI组的相关指标又显著低于高RFI组(P<0.05)。
表4 不同RFI组间比较分析

Table 4 Comparative analysis among different RFI groups

项目
Items
高RFI组
High RFI group
(n=40)
中RFI组
Medium RFI group
(n=59)
低RFI组
Low RFI group
(n=40)
P
P-value
剩余采食量RFI 0.08±0.04c 0.00±0.02b -0.07±0.03a <0.001
初始体重IBW/kg 20.87±3.38 19.66±2.15 20.10±2.20 0.288
终末体重FBW/kg 42.25±4.60 41.91±4.85 43.22±3.52 0.353
平均日采食量ADFI/kg 1.61±0.10c 1.52±0.10b 1.46±0.08a <0.001
平均日增重ADG/kg 0.32±0.04 0.33±0.05 0.34±0.04 0.066
饲料转化率FCR 5.14±0.49c 4.68±0.39b 4.36±0.43a <0.001
代谢体重MBW/kg 13.30±1.18 13.02±0.99 13.35±0.81 0.216
体高BH/cm 67.54±3.05b 66.81±3.33b 64.67±4.06a <0.001
体长BL/cm 78.99±4.91b 77.08±4.52b 74.65±5.05a <0.001
胸围ChC/cm 83.29±4.69b 81.39±5.17b 76.86±5.22a <0.001
管围CaC/cm 9.57±0.99b 9.47±0.77b 8.94±0.78a 0.001
胸深CD/cm 32.78±1.57 33.87±2.00 32.95±1.69 0.102
十字部高WH/cm 67.06±2.62 66.96±3.37 66.52±2.59 0.793
胸宽CW/cm 19.46±1.20 19.27±1.75 19.30±1.30 0.915
腰角宽HW/cm 17.44±1.05 17.35±1.68 17.43±1.41 0.973
阴囊围SC/cm 25.09±2.43 24.71±3.91 24.89±2.86 0.938

同行数据肩标无字母或相同字母表示差异不显著(P>0.05),不同小写字母表示差异显著(P≤0.05)。

Values in the same row with no letter or the same letter superscripts indicate no significant difference (P>0.05), while with different lowercase letter superscripts indicate significant difference (P≤0.05).

生长性状的分析结果表明,部分生长性状(如BH、BL、ChC、CaC、WH、CW、HW、SC)在组间呈现一定的差异。其中,BH、BL、ChC和CaC在高RFI组显著高于低RFI组(P<0.05)。然而,对于CD、WH、CW、HW和SC,各组间差异不显著(P>0.05)。

3 讨论

3.1 FE相关状及生长性状的变化规律

国内外关于肉羊FCR的研究较为丰富,但针对细毛羊的FE研究尚属少数。张小雪等[9]的研究表明,湖羊的FCR为5.77,ADG为0.27 kg;陈丽尧等[22]研究发现,滩羊公羊的FCR为5.70,ADG为0.28 kg,而滩羊母羊的FCR为6.71,ADG为0.20 kg;Yeaman等[23]的研究结果显示,杜泊羊和朗布耶羊的ADG分别为340和346 g/d。本研究结果显示,多胎细毛羊FCR为5.11,ADG为0.30 kg。这些结果表明,多胎细毛羊的FCR和ADG优于湖羊等本土品种,但ADG低于杜泊羊等国外品种。作为多胎型细毛羊品种,多胎细毛羊在FCR和ADG方面表现不逊色于其他本土肉羊品种。尽管上述研究的试验周期、饲粮成分及其他环境有所不同,导致FCR和ADG的数值存在一定差异,但本试验结果依然为多胎型细毛羊的FC提供数据支持。

3.2 FE相关性状及生长性状的相关性分析

多胎细毛羊公羔在80~160日龄不同阶段的BW、BL、BH、ChC相关系数多接近于1,表明这些性状在各阶段的生长趋势一致。RFI与FCR、ADFI均呈显著或极显著正相关,而与ADG无显著相关性。FCR与ADG在多个阶段呈现显著或极显著负相关,反映出ADG较高的个体通常具有较低的FCR。此外,ADG在各阶段与BW、BL等生长性状呈显著或极显著正相关,说明BW和BM的增加与ADG密切相关。MBW与其他体尺性状(如BH、CW)也表现出较强的相关性,表明MBW在羊群生长中的重要性。同时,CaC、SC等体尺性状与其他体尺性状(如ChC、BH)在不同阶段均表现出较高的相关性,表明羊群各部分在生长过程中具有一定的协调性。某些性状在不同阶段的相关系数较低,说明这些性状在部分阶段的变化并不完全同步,可能与个体差异有关。总体而言,羊群各生长性状之间表现出显著或极显著的正相关性,表明这些性状之间具有高度的协调生长趋势。李国泽等[24]对育肥期湖羊的研究结果表明,不同日龄阶段湖羊的BW与BM呈显著正相关,BW与ChC的相关系数最高。聂海涛[25]对育肥期杜湖杂交羔羊的研究,以及一些学者对育肥期湖羊的研究,也均发现RFI与FCR、DMI呈显著正相关[25-27]

3.3 不同RFI多胎细毛羊FC相关性状和生长性状间比较分析

多数研究中不同RFI组间ADFI、FCR存在极显著差异,而ADG、FBW不存在显著差异[9,25-26,28-29],这与本次试验研究结果一致。此外,BH、BL、ChC、CaC在高RFI组与低RFI组之间呈现显著差异。RFI的选择可能为提高效率提供机会,使动物吃得更少,同时不影响生长性能[30],相比传统的FCR,RFI通过考虑个体在生长速度和维持代谢水平上的差异,能够更好地反映动物在相同生产条件下的FE。选择低RFI的个体,即剩余饲料摄入量较低的动物,意味着这些动物在维持相同的生长性能和BW情况下,可以消耗更少的饲粮,从而有效降低生产成本。RFI的研究存在于多个物种之间,包括小鼠[31]、鸡[32]、猪[33]、绵羊[34]、水貂[35]、奶牛[36]。MBW解释动物饲粮摄入量中较大部分的变异(R2在0.48~0.73),相当一部分变异未能解释,这部分未解释的变异可能与不同物种、品种、性别、年龄、环境和其他生理过程有关[37]。Kennedy等[38]的研究指出,模型中对FI、生产性能和BW上进行多性状选择,并且在选择指数中结合各性状的相对经济权重。Shirzadifar等[35]将水貂的性别、颜色、年龄、BW和BL纳入特征,使用梯度提升决策树,十折交叉验证验证模型的机器学习算法来预测RFI。FE涉及复杂的生理过程,仅用单一的数学模型可能不足以准确描述能量利用的效率。不同物种和品种在生理、代谢和生长模式上存在显著差异,这些差异使得它们对采食量的预测存在不同的需求。因此,基于这些不同特征的多模型和多性状选择可能更加有效,以便更准确地反映每个品种或物种的能量利用效率,从而提高FE预测的准确性。

4 结论

在对育肥期(80~160日龄)多胎细毛羊公羔的研究中,全期FCR为5.11,ADG为0.30 kg;RFI与FCR、ADG呈显著或极显著正相关。低RFI组个体表现出最优FE,其FCR和ADFI均为最低,说明在FE方面,RFI相较FCR更具选择优势。
[1]
NKRUMAH J D, OKINE E K, MATHISON G W, et al. Relationships of feedlot feed efficiency,performance,and feeding behavior with metabolic rate,methane production,and energy partitioning in beef cattle[J]. Journal of Animal Science, 2006, 84(1):145-153.

[2]
CREWS D H D Jr. Genetics of efficient feed utilization and national cattle evaluation:a review[J]. Genetics and Molecular Research:GMR, 2005, 4(2):152-165.

[3]
ALENDE M, PORDOMINGO A J, ANDRAE J G, et al. Residual feed intake in cattle:physiological basis.A review[J]. Revista Argentina de Produccion Animal, 2016, 36(2):49-56.

[4]
ARCHER J A, RICHARDSON E C, HERD R M, et al. Potential for selection to improve efficiency of feed use in beef cattle:a review[J]. Australian Journal of Agricultural Research, 1999, 50(2):147-161.

[5]
AGGREY S E, KARNUAH A B, SEBASTIAN B, et al. Genetic properties of feed efficiency parameters in meat-type chickens[J]. Genetics Selection Evolution, 2010, 42(1):25.

[6]
AGGREY S E, REKAYA R. Dissection of Koch’s residual feed intake:implications for selection[J]. Poultry Science, 2013, 92(10):2600-2605.

[7]
DO D N, OSTERSEN T, STRATHE A B, et al. Genome-wide association and systems genetic analyses of residual feed intake,daily feed consumption,backfat and weight gain in pigs[J]. BMC Genetics, 2014,15:27.

[8]
KOCH R M, SWIGER L A, CHAMBERS D, et al. Efficiency of feed use in beef cattle[J]. Journal of Animal Science, 1963, 22(2):486-494.

[9]
ZHANG X X, WANG W M, MO F T, et al. Association of residual feed intake with growth and slaughtering performance,blood metabolism,and body composition in growing lambs[J]. Scientific Reports, 2017, 7(1):12681.

[10]
HOQUE M A, SUZUKI K, KADOWAKI H, et al. Genetic parameters for feed efficiency traits and their relationships with growth and carcass traits in Duroc pigs[J]. Journal of Animal Breeding and Genetics, 2007, 124(3):108-116.

PMID

[11]
张小雪. 不同剩余采食量羔羊生产性能和瘤胃微生物区系及肝脏转录组研究[D]. 博士学位论文. 兰州: 兰州大学, 2019.

ZHANG X X. Study on production performance,rumen microflora and liver transcriptome of lambs with different residual feed intake[D]. Ph.D.Thesis. Lanzhou: Lanzhou University, 2019. (in Chinese)

[12]
REDDEN R R, SURBER L M, GROVE A V, et al. Effects of residual feed intake classification and method of alfalfa processing on ewe intake and growth[J]. Journal of Animal Science, 2014, 92(2):830-835.

DOI PMID

[13]
ELLISON M J, CONANT G C, LAMBERSON W R, et al. Diet and feed efficiency status affect rumen microbial profiles of sheep[J]. Small Ruminant Research, 2017,156:12-19.

[14]
HEGARTY R S, GOOPY J P, HERD R M, et al. Cattle selected for lower residual feed intake have reduced daily methane production[J]. Journal of Animal Science, 2007, 85(6):1479-1486.

PMID

[15]
ARCE-RECINOS C, OJEDA-ROBERTOS N F, GARCIA-HERRERA R A, et al. Residual feed intake and rumen metabolism in growing Pelibuey sheep[J]. Animals, 2022, 12(5):572.

[16]
PAGANONI B, ROSE G, MACLEAY C, et al. More feed efficient sheep produce less methane and carbon dioxide when eating high-quality pellets[J]. Journal of Animal Science, 2017, 95(9):3839-3850.

DOI PMID

[17]
FITZSIMONS C, KENNY D A, DEIGHTON M H, et al. Methane emissions,body composition,and rumen fermentation traits of beef heifers differing in residual feed intake[J]. Journal of Animal Science, 2013, 91(12):5789-5800.

[18]
FERREIRA J, CRISÓSTOMO C, MARQUES N M, et al. Residual feed intake and behavior of sheep:besides being classified as ‘nibblers’ or ‘binge eaters’,can they also be considered ‘low water drinkers’ or ‘binge drinkers’?[J]. Applied Animal Behaviour Science, 2025,284:106547.

[19]
WANG Z T, WU W W, LV X F, et al. Effect of differences in residual feed intake on gastrointestinal microbiota of Dexin fine-wool meat sheep[J]. Frontiers in Microbiology, 2024,15:1482017.

[20]
ZHANG Y Z, ZHANG X W, CAO D R, et al. Integrated multi-omics reveals the relationship between growth performance,rumen microbes and metabolic status of Hu sheep with different residual feed intakes[J]. Animal Nutrition, 2024,18:284-295.

[21]
中华人民共和国农业农村部. 肉羊营养需要量标准:NY/T 816—2021[S]. 北京: 中国农业出版社, 2021.

Ministry of Agriculture and Rural Affairs of the People’s Republic of China. Nutrient requirements of meat-type sheep and goats:NY/T 816—2021[S]. Beijing: China Agriculture Press, 2021. (in Chinese)

[22]
陈丽尧, 和东迁, 卢童童, 等. 在不限定运动的情况下滩羊剩余采食量(RFI)的测定及与其他生长性能之间的关系[J]. 中国兽医学报, 2022, 42(1):154-159.

CHEN L Y, HE D Q, LU T T, et al. Measurement of residal feed intake(RFI) traits of Tan sheep and the relationship with other growth performance without restricting exercise[J]. Chinese Journal of Veterinary Science, 2022, 42(1):154-159. (in Chinese)

[23]
YEAMAN J C, WALDRON D F, WILLINGHAM T D. Growth and feed conversion efficiency of Dorper and Rambouillet lambs[J]. Journal of Animal Science, 2013, 91(10):4628-4632.

DOI PMID

[24]
李国泽, 张小雪, 李发弟, 等. 育肥期湖羊生长发育特征及生长模型[J]. 草业科学, 2020, 37(9):1880-1890.

LI G Z, ZHANG X X, LI F D, et al. Growth and development characteristics and growth model of Hu sheep in the fattening period[J]. Pratacultural Science, 2020, 37(9):1880-1890. (in Chinese)

[25]
聂海涛. 杜湖杂交肉羊育肥期能量、蛋白需要量的确定及不同RFI组肉羊生产性能和生长轴基因表达量差异性研究[D]. 博士学位论文. 南京: 南京农业大学, 2014.

NIE H T. Research of nutrient requirement for Dorper and Hu crossbred F1,sheep and application of residual feed intake in feeding efficiency evaluation[D]. Ph.D.Thesis. Nanjing: Nanjing Agricultural University, 2014. (in Chinese)

[26]
马万浩. 羔羊饲粮添加苜蓿干草对其育肥期生产性能和瘤胃功能的影响[D]. 硕士学位论文. 兰州: 兰州大学, 2019.

MA W H. Effects of adding alfalfa hay to lamb diets on their production performance and rumen function during fattening period[D]Master’s Thesis. Lanzhou: Lanzhou University, 2019. (in Chinese)

[27]
张德印, 张小雪, 李发弟, 等. 不同饲料效率与绵羊瘤胃组织形态学关系[J]. 中国农业科学, 2020, 53(24):5115-5124.

DOI

ZHANG D Y, ZHANG X X, LI F D, et al. Association of rumen histomorphology of sheep with different feed efficiencies[J]. Scientia Agricultura Sinica, 2020, 53(24):5115-5124. (in Chinese)

DOI

[28]
王子庭, 张志军, 王许, 等. 不同剩余采食量对德新肉用细毛羊生长性能、血清生化指标、肝脏及十二指肠黏膜抗氧化能力的影响[J]. 动物营养学报, 2024, 36(10):6549-6559.

DOI

WANG Z T, ZHANG Z J, WANG X, et al. Effects of different residual feed intake on growth performance,serum biochemical indexes,and antioxidant indexes in live and duodenal mucosa of Dexin meat-type fine wool sheep[J]. Chinese Journal of Animal Nutrition, 2024, 36(10):6549-6559. (in Chinese)

[29]
GURGEIRA D N, CRISÓSTOMO C, SARTORI L V C, et al. Characteristics of growth,carcass and meat quality of sheep with different feed efficiency phenotypes[J]. Meat Science, 2022,194:108959.

[30]
HERD R M, ODDY V H, RICHARDSON E C. Biological basis for variation in residual feed intake in beef cattle.1.Review of potential mechanisms[J]. Animal Production Science, 2004, 44(4/5):423-430.

[31]
ARCHER J A, PITCHFORD W S. Phenotypic variation in residual food intake of mice at different ages and its relationship with efficiency of growth,maintenance and body composition[J]. Animal Science, 1996, 63(1):149-157.

[32]
LUITING P, URFF E M. Optimization of a model to estimate residual feed consumption in the laying hen[J]. Livestock Production Science, 1991, 27(4):321-338.

[33]
FAURE J, LEFAUCHEUR L, BONHOMME N, et al. Consequences of divergent selection for residual feed intake in pigs on muscle energy metabolism and meat quality[J]. Meat Science, 2013, 93(1):37-45.

DOI PMID

[34]
LIMA N L L, RIBEIRO C R D F, H C M D, et al. Economic analysis,performance,and feed efficiency in feedlot lambs[J]. Revista Brasileira de Zootecnia, 2017, 46(10):821-829.

[35]
SHIRZADIFAR A, MANAFIAZAR G, DAVOUDI P, et al. Prediction of growth and feed efficiency in mink using machine learning algorithms[J]. Animal, 2025, 19(2):101330.

[36]
FIDELIS H A, BONILHA S F M, TEDESCHI L O, et al. Residual feed intake,carcass traits and meat quality in Nellore cattle[J]. Meat Science, 2017,128:34-39.

[37]
KNOTT S A, CUMMINS L J, DUNSHEA F R, et al. The use of different models for the estimation of residual feed intake (RFI) as a measure of feed efficiency in meat sheep[J]. Animal Feed Science and Technology, 2008, 143(1/2/3/4):242-255.

[38]
KENNEDY B W, VAN DER WERF J H, MEUWISSEN T H. Genetic and statistical properties of residual feed intake[J]. Journal of Animal Science, 1993, 71(12):3239-3250.

DOI PMID

Outlines

/