RESEARCH PAPER

Construction of Conventional Nutritional Component Content Prediction Models of Whole Plant Corn Silage Based on Near-Infrared Reflectance Spectroscopy

  • LYU Longfei ,
  • ZHANG Miaomiao ,
  • BAO Xiang ,
  • HAN Xing ,
  • XIE Tao ,
  • LI Xiao ,
  • HUANG Yinghao ,
  • ZHUO Zhao ,
  • LIU Sijia ,
  • FAN Caiyun ,
  • CHENG Jianbo , *
Expand
  • College of Animal Science and Technology, Anhui Agricultural University, Hefei 230036, China
*professor, E-mail:

Received date: 2025-03-04

  Online published: 2025-10-15

Abstract

This experiment aimed to use near-infrared reflectance spectroscopy (NIRS) technology to establish prediction models of conventional nutritional component content in whole plant corn silage, to provide theoretical guidance for the scientific utilization and precise nutritional regulation of whole plant corn silage feed resources. A total of 104 whole plant corn silage samples were collected from 16 provincial-level administrative regions of Anhui, Shandong, Hebei, Liaoning, Hunan, Shaanxi, Ningxia, Henan, Inner Mongolia, Xinjiang, Heilongjiang, Shanghai, Guangdong, Gansu, Shanxi and Jilin, and randomly divided into a calibration set (n=83) and a verification set (n=21). The modified partial least squares (MPLS) were performed and combined with 7 de-scattering treatments and 3 derivative treatments to establish NIRS prediction models for 9 conventional nutritional component contents, including dry matter (DM), crude protein (CP), ether extract (EE), acid detergent fiber (ADF), neutral detergent fiber (NDF), crude ash (Ash), calcium (Ca), phosphorus (P) and starch (Starch). The results showed that the coefficient of determination for validation (RSQv) of DM, CP, ADF, NDF, Ash and Starch contents in whole plant corn silage of NIRS prediction models were above 0.90, and the corresponding ratio of performance to deviation for validation (RPDv) were all >2.50, had good predictive effects; the RSQv of EE, Ca and P contents in whole plant corn silage of NIRS prediction models were 0.66 to 0.80, and the corresponding RPD values were all<2.00, could be used for rough prediction. Comprehensively, the NIRS prediction models for whole plant corn silage established in this study can be used to predict DM, CP, ADF, NDF, Ash and Starch contents in actual production, and roughly predict the EE, Ca and P contents.

Cite this article

LYU Longfei , ZHANG Miaomiao , BAO Xiang , HAN Xing , XIE Tao , LI Xiao , HUANG Yinghao , ZHUO Zhao , LIU Sijia , FAN Caiyun , CHENG Jianbo . Construction of Conventional Nutritional Component Content Prediction Models of Whole Plant Corn Silage Based on Near-Infrared Reflectance Spectroscopy[J]. Chinese Journal of Animal Nutrition, 2025 , 37(10) : 7110 -7120 . DOI: 10.12418/CJAN2025.579

全株玉米青贮作为反刍动物的重要粗饲料来源,其营养价值直接关系到动物的生产性能和养殖效益[1]。准确、快速地测定全株玉米青贮的常规营养成分含量对于饲料配方优化、营养价值评估和精准饲养管理具有重要意义[2]。然而,传统的湿化学分析方法虽然准确度高,但存在操作繁琐、耗时长、成本高等缺点,难以满足现代畜牧业对快速检测的需求,并严重影响牧场精准营养方案的执行效率[3]。近红外反射光谱(near-infrared reflectance spectroscopy,NIRS)技术作为一种快速、无损的分析方法,近年来在饲料品质检测领域得到了广泛应用。该技术基于被检测物质中不同分子基团振动对近红外光的吸收特性,能够快速获取样品中的分子基团的光谱图,采用化学计量学算法对光谱数据进行特征提取与建模处理,构建光谱特征与待测组分含量之间的定量校正模型,实现对样品化学成分含量的定量分析[4]。与传统方法相比,NIRS技术具有分析速度快、样品前处理简单、可同时测定多种成分等优势,特别适合大批量样品的快速筛查和质量控制[5-7]
目前,NIRS技术已在玉米秸秆[8]、苜蓿[9]和羊草[10]等单一饲料原料的成分分析中取得了良好效果,但在全株玉米青贮这类复杂饲料中的应用仍面临挑战。全株玉米青贮的成分复杂且变异较大,其光谱特征容易受到水分、颗粒大小、发酵程度、品种和产地来源等因素的影响,增加了建模的难度。Liu等[11]选取125个全株玉米青贮样品所建立的NIRS预测模型可以准确预测干物质(DM)、粗蛋白质(CP)、中性洗涤纤维(NDF)、酸性洗涤纤维(ADF)等营养成分含量;王新基等[12]从甘肃、宁夏、青海等5个地区采集了80份样品,利用改良偏最小二乘法(modified partial least squares,MPLS)建立的NIRS预测模型对全株玉米青贮中DM、CP、ADF和粗灰分(Ash)含量预测效果比较好,对粗脂肪(EE)和NDF含量预测效果较差;崔盈盈[13]采用偏最小二乘法(partial least squares,PLS)结合导数处理和散射校正所建立的全株玉米青贮NIRS预测模型,对CP和磷(P)含量可以实现准确预测,而对NDF、ADF和淀粉(Starch)含量只能粗略预测,对EE含量不能预测。上述学者在建模过程中所采用的样品来源地域分布较为局限,且所涵盖的营养成分指标尚不够全面,这在一定程度上限制了NIRS预测模型的普适性和应用范围[14]。因此,建立适用于全株玉米青贮的NIRS预测模型,需要解决样品代表性、光谱预处理、模型优化等关键问题。
本研究旨在利用NIRS技术建立全株玉米青贮常规营养成分含量的快速预测模型,通过收集具有广泛代表性的全株玉米青贮样品,采用标准化学方法测定其常规营养成分含量,并结合多种光谱预处理和建模方法,优化模型性能。本研究结果可为全株玉米青贮的快速质量评价提供技术支持,对提高饲料检测效率、精准饲养管理具有重要意义。同时,本研究结果也可为NIRS技术在其他复杂饲料中的应用提供参考,推动饲料分析技术的创新与发展。

1 材料与方法

1.1 样品采集与制备

于2024年8—10月期间,采集来自全国各全株玉米青贮主产地(包括安徽、山东、河北、辽宁、湖南、陕西、宁夏、河南、内蒙古、新疆、黑龙江、上海、广东、甘肃、山西和吉林16个省级行政区)共104份全株玉米青贮,样品分布区域情况如表1所示。选用九点取样法在青贮窖面采集无霉变的全株玉米青贮样品,每份采集约1 000 g,注明采样信息后立即密封在真空包装袋中并加入冰袋低温运输[15]。样品带回实验室后,立刻烘干,粉碎后过18目筛样品用于纤维类成分的检测,过40目筛样品用于其余常规成分的检测。样品混合均匀,装入密封袋室温保存。
表1 全株玉米青贮样品分布区域

Table 1 Distribution area of whole plant corn silage samples

项目
Items
采样数
Number of
samples


安徽Anhui
合肥市 12
六安市 2
淮北市 1
滁州市 2
宿州市 8
亳州市 2
山东Shandong 潍坊市 13
山西Shanxi 太原市 1
陕西Shaanxi 渭南市 5


辽宁Liaoning
阜新市 2
沈阳市 2
锦州市 2

甘肃Gansu
兰州市 1
张掖市 5

宁夏Ningxia
银川市 10
吴忠市 2

湖南Hunan
常德市 5
邵阳市 2
新疆Xinjiang 3
河南Henan 郑州市 4
吉林Jilin 长春市 2
广东Guangdong 广州市 2

黑龙江Heilongjiang
齐齐哈尔市 1
黑河市 5
河北Hebei 石家庄市 3

内蒙古Inner Mongolia
呼和浩特市 2
巴卓彦尔市 4
上海Shanghai 1

1.2 原始光谱的采集

采用NIRS仪(DS-2500F,丹麦FOSS公司)采集全株玉米青贮样品原始光谱,每次开机前预热30 min以保持基线稳定,上机装样量为样品杯的2/3。NIRS仪系统光谱响应范围覆盖850~2 500 nm特征波段,光谱分辨率为0.5 nm。取每个样品独立3次取样所扫描的平均光谱作为该样品的原始光谱[16]

1.3 常规营养成分含量的测定

DM含量采用烘干法,参照GB/T 6435—2014[17],利用鼓风干燥箱(DHG-9246A,上海精宏实验设备有限公司)测定。CP含量采用凯氏定氮法,参照GB/T 6432—2018[18],利用全自动凯氏定氮仪(K9840,济南海能仪器股份有限公司)测定。钙(Ca)含量采用乙二胺四乙酸络合滴定法,参照GB/T 6436—2018[19],利用紫外可见分光光度计(TU-1810,北京普析通用仪器有限责任公司)测定。P含量采用分光光度法,参照GB/T 6437—2018[20],利用紫外可见分光光度计(TU-1810,北京普析通用仪器有限责任公司)测定。Ash含量采用灼烧法,参照GB/T 6438—2007[21],利用箱式电阻炉(SX2-4-10G,江苏泰州市天泰电热仪器厂)测定。EE含量采用索氏抽提法,参照GB/T 6433—2006[22],利用粗脂肪测定仪(SZF-06A,上海新嘉电子有限公司)测定。NDF、ADF含量采用滤袋技术法,分别参照GB/T 20806—2022[23]和NY/T 1459—2007[24],利用全自动纤维分析仪(XF2860,上海纤检仪器有限公司)测定。Starch含量采用旋光法,参照GB/T 20194—2018[25],利用智能水浴冷凝回流提取仪(NAI-HL12S,上海那艾实验仪器有限公司)测定。每个试样取3个平行样本进行测定,在误差允许范围内,以3次测定结果的算术平均值作为最终测定值,并以DM基础进行结果计算。

1.4 全株玉米青贮定标模型的建立

将所得到的各样品NIRS原始光谱和其所对应各营养成分湿化学分析值导入丹麦FOSS公司开发的WinISI Ⅲ软件中进行分析,将其全部样本按照4∶1的比例随机分为定标集(n=83)和验证集(n=21),用于构建其定标模型和后续外部验证,使用MPLS对每种营养成分单独建模。NIRS仪采集到的光谱信息中除对应目标成分的特征吸收峰外还包含着各种噪音信号,为了提高信噪比,采用7种去散射处理与3种导数处理相结合,共21种方法对样品原始光谱进行预处理。7种去散射处理方法包括无处理(non-treatment,None)、标准正态变量校正(standard normal variate correction,SNV)、去趋势校正(detrend correction,Detrend)、标准正态变量校正结合去除趋势校正(standard normal variate plus detrend correction,SNVD)、标准多元去散射校正(standard multiplicative scatter correction,SMSC)、加权多元去散射校正(weighted multiplicative scatter correction,WMSC)及反相多元去散射校正(inverse multiplicative scatter correction,IMSC)。导数处理方法的参数组合分别为0,0,1,1、1,4,4,1、2,4,4,1,依次对应导数阶数、数据间隔、一次数据间隔和二次数据间隔。对原始光谱进行二阶导数和SNVD结合二阶导数处理,观察是否有异常光谱结果。针对每种营养成分,通过筛选最佳预处理方法建立相应的NIRS预测模型[26]

1.5 全株玉米青贮定标模型的验证和评价

全株玉米青贮定标模型的验证分为内部交叉验证和外部验证,内部交叉验证采用全局距离(global hood,GH)和“T”检验,分2阶段执行异常值剔除。其中,若样本的GH值≥10,则判定为光谱异常样本,需排除;若T>2.5,则表明该样本预测值与湿化学分析值的残差绝对值大于2.5倍校正集残差标准差,判定为化学异常样本,超出模型适用范围,予以剔除[8]
定标模型建立后,以交叉验证相关系数(coefficient of determination for cross-validation,1-VR)、校正标准误差(standard error of calibration,SEC)、交互验证标准误差(standard error of cross-validation,SECV)3个指标表示定标模型的好坏。其中,SEC、SECV值越小,1-VR值越接近1代表代表模型预测误差越小,模型越可靠;然后用独立验证集对模型进行外部验证,利用验证集的传统分析结果与模型的预测值对比,以验证决定系数(coefficient of determination for validation,RSQv)和外部验证相对分析误差(ratio of performance to deviation for validation,RPDv)表示外部验证结果,在模型评估中,当RSQv达到1时,表明模型能够完全解释定标集含量的变化。通常认为,当RSQv超过0.80时,判定模型具备实际预测价值;当RSQv介于0.66~0.80时,模型可用于粗略预测;RSQv低于0.66时,模型不适合实际预测。此外,RPDv是衡量模型预测能力的另一关键指标。根据目前饲料行业的标准,若RPDv≥2.5,表明模型预测性能良好,适用于实际检测;若2.0<RPDv<2.5,模型可用于初步筛选样品;RPDv≤2.0时,模型预测能力有限,应用受限[26-27]

2 结果与分析

2.1 全株玉米青贮样品NIRS图

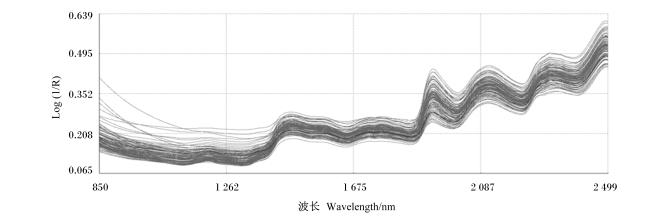
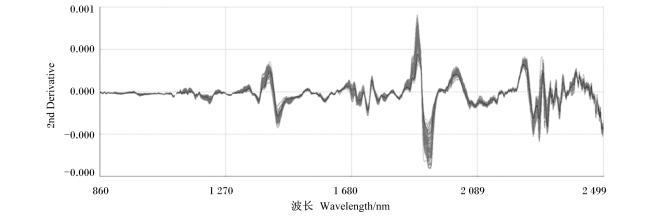
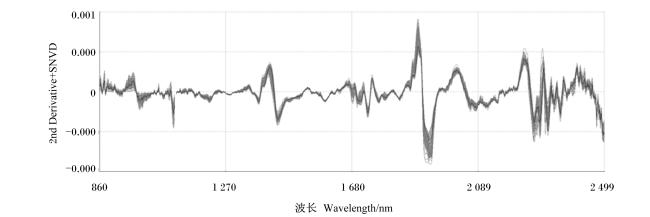
图1所示,各全株玉米青贮样品原始光谱变化趋势一致,特定波段都具有相似形状的吸收峰;由于各全株玉米青贮样品化学组分差异和检测时干扰噪声的引入[28-29],其吸收曲线表现为上下波动。如图2所示,为了消除由于基线漂移和散射等各方面的非目标噪音信号影响[30],对各全株玉米青贮样品原始光谱进行处理后发现,经过二阶导数处理使特征吸收峰更加清晰可见,同时减少基线波动现象。如图3所示,再将二阶导数处理结合SNVD后,可以发现不同全株玉米青贮样品间的光谱位置偏移得到明显修正,且成功消除了颗粒散射造成的干扰信号。
图1 104份全株玉米青贮样品原始光谱

R:反射率 reflectivity。

Fig.1 Raw spectra of 104 whole-plant corn silage samples

图2 104份全株玉米青贮样品二阶导数处理(2,4,4,1)光谱

2nd Derivative:二阶导数处理 second derivative treatment。

Fig.2 Spectra of 104 whole-plant corn silage samples with second derivative treatment (2,4,4,1)

图3 104份全株玉米青贮样品二阶导数(2,4,4,1)结合SNVD光谱

2nd Derivative+SNVD:二阶导数处理结合SNVD second derivative treatment combined with SNVD。

Fig.3 Spectra of 104 whole-plant corn silage samples with second derivative treatment (2,4,4,1) combined with SNVD

2.2 全株玉米青贮常规营养成分含量

表2所示,全集104份全株玉米青贮常规营养成分含量分布范围较广,能够有效涵盖样品的多样性,具有较强的代表性。同时,标准偏差较小,表明数据分布集中且稳定性较高,这为建立稳健且可靠的NIRS定标模型提供了理想的数据基础。
表2 全株玉米青贮常规营养成分含量

Table 2 Conventional nutritional component contents of whole plant corn silage

项目
Items
样品集
Sample set
样品数
Sample
number
含量范围
Content
range/%
平均值
Mean/%
标准偏差
SD/%
变异系数
CV/%


干物质DM
全集 104 27.43~39.56 33.24 2.09 6.29
定标集 83 27.43~39.56 33.22 2.20 6.61
验证集 21 29.29~36.15 33.27 1.67 5.01


粗蛋白质CP
全集 104 5.32~9.69 7.89 0.71 8.98
定标集 83 5.32~9.69 7.88 0.75 9.50
验证集 21 6.61~9.15 7.95 0.52 6.49


粗脂肪EE
全集 104 1.18~6.15 3.53 1.04 29.32
定标集 83 1.18~6.15 3.53 1.10 31.18
验证集 21 1.52~4.93 3.53 0.72 20.34


酸性洗涤纤维ADF
全集 104 15.51~38.30 22.53 4.55 20.22
定标集 83 15.51~38.30 22.65 4.74 20.91
验证集 21 16.80~33.20 22.02 3.70 16.80


中性洗涤纤维NDF
全集 104 26.98~65.89 36.15 7.13 19.72
定标集 83 26.98~65.89 36.66 7.59 20.72
验证集 21 27.72~47.38 34.15 4.31 12.63


粗灰分Ash
全集 104 3.01~8.24 4.85 1.00 20.71
定标集 83 3.01~8.24 4.82 1.03 21.27
验证集 21 3.58~7.75 4.94 0.91 18.36


钙Ca
全集 104 0.04~0.50 0.22 0.10 43.37
定标集 83 0.04~0.50 0.22 0.10 45.49
验证集 21 0.10~0.34 0.21 0.07 31.42


磷P
全集 104 0.11~0.31 0.19 0.03 17.94
定标集 83 0.11~0.27 0.19 0.03 17.38
验证集 21 0.13~0.31 0.19 0.04 19.96


淀粉Starch
全集 104 2.06~40.73 29.17 8.26 28.32
定标集 83 2.06~40.73 28.74 8.57 29.81
验证集 21 11.47~39.35 30.83 6.65 21.55

2.3 全株玉米青贮常规营养成分最佳光谱预处理方式的选择

表3所示,全株玉米青贮常规营养成分最佳定标模型所用光谱预处理方式的选择中,DM为WMSC+0,0,1,1,CP为IMSC+1,4,4,1,EE为SNVD+0,0,1,1,ADF为WMSC+0,0,1,1;NDF为SNVD+2,4,4,1,Ash为WMSC+2,4,4,1,Ca为Detrend+2,4,4,1,P为WMSC+1,4,4,1,Starch为WMSC+2,4,4,1。全株玉米青贮中DM、CP、EE、ADF、NDF、Ash、Ca、P和Starch的SEVC分别为0.457 6、0.189 4、0.833 1、1.580 8、1.961 6、0.311 9、0.061 4、0.021 2和1.785 6,1-VR分别为0.953 2、0.934 4、0.439 2、0.893 6、0.934 7、0.896 2、0.631 4、0.561 2和0.960 1。
表3 全株玉米青贮常规营养成分最佳光谱预处理方式

Table 3 Optimal spectral preprocessing method of conventional nutritional components of whole plant corn silage

项目
Items
散射处理
Scattering
processing
导数处理
Derivative
processing
校正标
准误差
SEC
交互验证
标准误差
SECV
交叉验证
相关系数
1-VR
干物质DM WMSC 0,0,1,1 0.422 2 0.457 6 0.953 2
粗蛋白质CP IMSC 1,4,4,1 0.150 4 0.189 4 0.934 4
粗脂肪EE SNVD 0,0,1,1 0.731 6 0.833 1 0.439 2
酸性洗涤纤维ADF WMSC 0,0,1,1 1.479 6 1.580 8 0.893 6
中性洗涤纤维NDF SNVD 2,4,4,1 1.322 2 1.961 6 0.934 7
粗灰分Ash WMSC 2,4,4,1 0.238 6 0.311 9 0.896 2
钙Ca Detrend 2,4,4,1 0.043 4 0.061 4 0.631 4
磷P WMSC 1,4,4,1 0.017 3 0.021 2 0.561 2
淀粉Starch WMSC 2,4,4,1 1.527 9 1.785 6 0.960 1

WMSC:加权多元去散射校正 weighted multiplicative scatter correction;IMSC:反相多元去散射校正 inverse multiplicative scatter correction;SNVD:标准正态变量校正结合去除趋势校正 standard normal variate plus detrend correction;Detrend:去趋势校正 detrend correction。

2.4 全株玉米青贮NIRS预测模型的外部验证

表4所示,EE、Ca和P含量NIRS预测模型的RSQv分别为0.661、0.724和0.699,均在0.66~0.80,其余营养成分含量NIRS预测模型的RSQv均>0.900;EE、Ca和P含量NIRS预测模型的RPDv分别为1.577、1.865和1.500,均<2.000,其余营养成分含量NIRS预测模型的RPDv均>2.500,且DM和Starch含量NIRS预测模型的RPDv都在4.500以上,表明所建立的NIRS预测模型可以对除Ca、P和EE含量外的其他营养成分含量准确预测,而对Ca、P和EE含量粗略预测。
表4 全株玉米青贮NIRS预测模型的外部验证结果

Table 4 External verification results of NIRS predictive model for whole plant corn silage

项目
Items
化学测定
平均值
Chemical
determination
average value/%
模型预
测平均值
Model
prediction
average value/%
偏差
Bias/%
预测标
准误差
SEP
验证决定
系数
RSQv
外部验证相对
分析误差
RPDv
干物质DM 33.270 33.538 -0.268 0.359 0.980 4.825
粗蛋白质CP 7.955 7.997 -0.042 0.157 0.914 3.293
粗脂肪EE 3.530 3.800 -0.270 0.641 0.661 1.577
酸性洗涤纤维ADF 22.019 21.466 0.552 1.059 0.922 3.472
中性洗涤纤维NDF 34.152 34.121 0.031 1.043 0.944 3.923
粗灰分Ash 4.940 4.784 0.156 0.256 0.950 3.492
钙Ca 0.212 0.211 0.001 0.052 0.724 1.865
磷P 0.192 0.189 0.003 0.022 0.699 1.500
淀粉Starch 30.830 30.713 0.116 1.024 0.978 6.799

3 讨论

NIRS技术的测定精度受多重因素影响,可归纳为:建模样品的来源与预处理方式的科学选择、参比湿化学分析值测定精度的高度控制、NIRS仪性能的优化以及环境因素的严格调控[31-32]。其中,前两者对模型预测精度的影响最为显著。何可可等[32]研究指出,在建立NIRS预测模型时,所选样品应具有代表性且样品间具有离散性。陈菲等[33]研究发现,经过烘干粉碎后建立的青贮样品预测模型更加精准。纳嵘等[9]采用MPLS结合20种光谱预处理组合成功建立了苜蓿营养成分NIRS预测模型。针对不同营养成分选择合适的光谱预处理方式可以使模型预测更加精确。Li等[34]研究指出,其研究中开发的NIRS预测模型显示出较高的预测性能,这与湿化学分析值的质量直接相关。
本研究中,全株玉米青贮DM和CP含量的NIRS预测模型预测性能优良,这与王新基等[12]在全株玉米青贮中对DM和CP含量预测的研究结果一致。Lobos等[35]使用偏最小二乘回归(PLSR)在智利南部新鲜牧场样品中所开发的营养成分NIRS校准模型结果也与本试验结果相似,其验证集中的决定系数在0.69~0.93,预测误差在0.064~2.89,其模型的评估证实了运用NIRS对DM和CP含量的高预测能力。ADF和NDF含量的预测效果也很好,这与刘强等[36]和唐德富等[37]在青贮玉米中对ADF和NDF预测模型的研究结果基本一致。Oluk等[38]运用NIRS预测珍珠栗青贮饲料中的CP、Ash、ADF、NDF和酸性洗涤木质素(ADL)含量,结果表明所建立的NDF和ADF预测模型预测精度相对较高,也与本研究结果类似。推测其原因可能为:全株玉米青贮较高的ADF和NDF含量导致其在NIRS谱区的相关吸收峰强度较高,更易被模型捕捉。Ash含量的预测效果也比较好,高于郭丽丽[39]在青贮玉米中的建立的Ash定量模型。推测其原因可能是本研究所采集样品覆盖全国,样品Ash含量分布较广,涵盖了低、中、高不同水平,这种广泛的分布有助于模型捕捉到Ash的光谱特征,从而提高了模型预测效果[40]。Starch含量的预测效果良好,这与曹明月等[41]的研究结果不一致,本研究通过3次平行测定的湿化学分析确保了Starch含量的高精度测定,同时所采集的全株玉米青贮发酵水平优异且Starch含量高,其含氢基团在NIRS谱区产生显著吸收峰,从而显著提升了模型的拟合能力[37]。对EE含量的预测性能比较差,这与白琪林[42]对青贮玉米和Dias等[43]在玉米青贮饲料中的研究结果一致,其原因可能是由于全株玉米青贮样品中EE含量较低,其含量范围已接近于NIRS的最低检出限1%,导致其所对应预测模型精度较低。对Ca和P含量的预测性能不理想,这与冯豆等[29]在花生秧中的研究结果一致,但与崔盈盈[13]在全株玉米青贮中的研究结果不一致,推测其原因可能为矿物质在NIRS谱区的吸收特征较弱,且样本Ca和P含量变异过大,导致模型难以拟合,并且Starch和纤维素的强吸收峰可能掩盖Ca和P的微弱信号,导致模型难以准确预测其含量[44]。样本数量不足也可能会影响定标模型精准度,Renner等[45]认为用更多的样本数量可能有助于提高NIRS预测模型的准确度,Li等[46]基于149份不同产地燕麦样品所建立的EE含量NIRS预测模型比本研究预测效果好,其决定系数达到0.903。本研究中Ca、P和EE含量NIRS预测性能较差的原因也可能与样本量较小有关。
目前,在已构建的全株玉米青贮NIRS预测模型基础上,还需进一步扩充模型样本数量,筛选更具代表性的定标样品,以扩展模型的适用范围并提升其预测精度。通过建立一套完善的全株玉米青贮常规营养成分含量NIRS预测模型,可为提高全株玉米青贮资源的高效综合利用提供快速、精准的检测手段,从而为其在饲料工业中的科学应用提供有力支持。

4 结论

本研究利用NIRS技术建立起了全国主要产区的全株玉米青贮DM、CP、EE、ADF、NDF、Ash、Ca、P和Starch共9个常规营养成分含量的NIRS预测模型,其中建立的DM、CP、ADF、NDF、Ash、Starch含量的NIRS预测模型效果优良,可以用于实际检测;建立的EE、Ca和P含量的NIRS预测模型可以用于粗略预测。
[1]
曹晓波, 梁占东, 张燕. 全株玉米青贮制作原则及关键点分析[J]. 中国乳业, 2022(9):7-13.

CAO X B, LIANG Z D, ZHANG Y. Principle and key points analysis of making whole corn silage[J]. China Dairy, 2022(9):7-13. (in Chinese)

[2]
刘娜, 王俊, 屠焰, 等. 玉米青贮饲料质量评定及其营养成分快速检测方法的建立[J]. 家畜生态学报, 2019, 40(10):1-7.

LIU N, WANG J, TU Y, et al. The quality evaluation and the development of rapid detection method for nutrient components of corn silage[J]. Acta Ecologae Animalis Domastici, 2019, 40(10):1-7. (in Chinese)

[3]
陈素彬, 胡振. 优化的近红外光谱LS-SVM模型测定小麦蛋白质[J]. 食品工业, 2019, 40(12):329-333.

CHEN S B, HU Z. Determination of wheat protein by optimized near infrared spectrum LS-SVM model[J]. The Food Industry, 2019, 40(12):329-333. (in Chinese)

[4]
徐广通, 袁洪福, 陆婉珍. 现代近红外光谱技术及应用进展[J]. 光谱学与光谱分析, 2000, 20(2):134-142.

XU G T, YUAN H F, LU W Z. Development of modern near infrared spectroscopic techniques and its applications[J]. Spectroscopy and Spectral Analysis, 2000, 20(2):134-142. (in Chinese)

[5]
ZAHIR S D A M, JAMLOS M F, OMAR A F, et al. Review-plant nutritional status analysis employing the visible and near-infrared spectroscopy spectral sensor[J]. Spectrochimica Acta.Part A,Molecular and Biomolecular Spectroscopy, 2024,304:123273.

[6]
刘庭恺, 胡子康, 龙婉君, 等. 基于近红外和中红外光谱的杜仲产地溯源[J]. 化学试剂, 2022, 44(7):952-959.

LIU T K, HU Z K, LONG W J, et al. Geographical origin traceability of Eucommiae cortex based on near and mid infrared spectroscopy[J]. Chemical Reagents, 2022, 44(7):952-959. (in Chinese)

[7]
霍学松, 陈瀑, 戴嘉伟, 等. 微小型近红外光谱仪的应用进展与展望[J]. 分析测试学报, 2022, 41(9):1301-1313.

HUO X S, CHEN P, DAI J W, et al. Progress and prospect of application of miniatured near infrared spectrometers[J]. Journal of Instrumental Analysis, 2022, 41(9):1301-1313. (in Chinese)

[8]
郭涛, 黄右琴, 兰贵生, 等. 利用近红外光谱技术分析玉米秸秆和小麦秸秆的营养成分[J]. 草业科学, 2020, 37(6):1204-1213.

GUO T, HUANG Y Q, LAN G S, et al. Quantitative analysis of nutrients in corn straw and wheat straw using near-infrared spectroscopy[J]. Pratacultural Science, 2020, 37(6):1204-1213. (in Chinese)

[9]
纳嵘, 任晋东, 胡波, 等. 基于不同预处理方法建立苜蓿营养成分近红外快速分析模型的研究[J]. 家畜生态学报, 2021, 42(12):37-43.

NA R, REN J D, HU B, et al. Establishment of near infrared quantitative analysis model for nutritional components in alfalfa based on different pre-treatment methods[J]. Acta Ecologae Animalis Domastici, 2021, 42(12):37-43. (in Chinese)

[10]
常春, 侯向阳, 武自念, 等. 近红外光谱法测定羊草干草的9项品质指标[J]. 中国草地学报, 2019, 41(5):47-52.

CHANG C, HOU X Y, WU Z N, et al. Nine quality indexes determination of Leymus chinensis hay by near infrared reflectance spectroscopy[J]. Chinese Journal of Grassland, 2019, 41(5):47-52. (in Chinese)

[11]
LIU X, HAN L J. Prediction of chemical parameters in maize silage by near infrared reflectance spectroscopy[J]. Journal of Near Infrared Spectroscopy, 2006, 14(5):333-339.

[12]
王新基, 郭涛, 潘发明, 等. 利用近红外光谱技术快速分析全株玉米青贮营养成分[J]. 家畜生态学报, 2021, 42(1):52-55.

WANG X J, GUO T, PAN F M, et al. Rapid analysis of nutritional components of whole plant silage using near-infrared spectroscopy[J]. Acta Ecologae Animalis Domastici, 2021, 42(1):52-55. (in Chinese)

[13]
崔盈盈. 奶牛四种饲料营养成分快速测定NIRS模型的优化与应用[D].硕士学位论文. 新乡: 河南科技学院, 2022.

CUI Y Y. Rapid determination of four feed nutrients and optimization and application of NIRS model in dairy cows[D].Master’s Thesis. Xinxiang: Henan Institute of Science and Technology, 2022. (in Chinese)

[14]
MURGUZUR F J A, BISON M, SMIS A, et al. Towards a global arctic-alpine model for near-infrared reflectance spectroscopy (NIRS) predictions of foliar nitrogen,phosphorus and carbon content[J]. Scientific Reports, 2019, 9(1):8259.

[15]
国家市场监督管理总局, 国家标准化管理委员会. 饲料采样:GB/T 14699—2023[S]. 北京: 中国标准出版社, 2024.

State Administration for Market Regulation, Standardization Administration of the People’s Republic of China. Feed-sampling:GB/T 14699—2023[S]. Beijing: Standards Press of China, 2024. (in Chinese)

[16]
付趁, 巴提玛·努尔巴合提, 马慧慧, 等. 基于近红外光谱的花生秧营养组分预测模型构建[J]. 动物营养学报, 2023, 35(7):4697-4705.

DOI

FU C, BA TI MA N, MA H H, et al. Construction of nutrient component prediction model of peanut vines based on near infrared spectroscopy[J]. Chinese Journal of Animal Nutrition, 2023, 35(7):4697-4705. (in Chinese)

DOI

[17]
中华人民共和国国家质量监督检验检疫总局, 中国国家标准化管理委员会. 饲料中水分的测定:GB/T 6435—2014[S]. 北京: 中国标准出版社, 2015.

General Administration of Quality Supervision, Inspection and Quarantine of the People’s Republic of China, Standardization Administration of the People’s Republic of China. Determination of moisture in feedstuffs:GB/T 6435—2014[S]. Beijing: Standards Press of China, 2015. (in Chinese)

[18]
国家市场监督管理总局, 国家标准化管理委员会. 饲料中粗蛋白的测定凯氏定氮法:GB/T 6432—2018[S]. 北京: 中国标准出版社, 2018.

State Administration for Market Regulation, Standardization Administration of the People’s Republic of China. Determination of crude protein in feeds-Kjeldahl method:GB/T 6432—2018[S]. Beijing: Standards Press of China, 2018. (in Chinese)

[19]
国家市场监督管理总局, 中国国家标准化管理委员会. 饲料中钙的测定:GB/T 6436—2018[S]. 北京: 中国标准出版社, 2018.

State Administration for Market Regulation, Standardization Administration of the People’s Republic of China. Determination of calcium in feeds:GB/T 6436—2018[S]. Beijing: Standards Press of China, 2018. (in Chinese)

[20]
国家市场监督管理总局, 国家标准化管理委员会. 饲料中总磷的测定分光光度法:GB/T 6437—2018[S]. 北京: 中国标准出版社, 2018.

State Administration for Market Regulation, Standardization Administration of the People’s Republic of China, Standardization Administration of the People’s Republic of China. Determination of phosphorus in feeds-spectrophotometry:GB/T 6437—2018[S]. Beijing: Standards Press of China, 2018. (in Chinese)

[21]
中华人民共和国国家质量监督检验检疫总局, 中国国家标准化管理委员会. 饲料中粗灰分的测定:GB/T 6438—2007[S]. 北京: 中国标准出版社, 2007.

General Administration of Quality Supervision,Inspection and Quarantine of the People’s Republic of China, Standardization Administration of the People’s Republic of China. Animal feeding stuffs-determination of crude ash:GB/T 6438—2007[S]. Beijing: Standards Press of China, 2007. (in Chinese)

[22]
中华人民共和国国家质量监督检验检疫总局, 中国国家标准化管理委员会. 饲料中粗脂肪的测定:GB/T 6433—2006[S]. 北京: 中国标准出版社, 2006.

General Administration of Quality Supervision,Inspection and Quarantine of the People’s Republic of China, Standardization Administration of the People’s Republic of China. Determinaiion of crude fat in feeds:GB/T 6433—2006[S]. Beijing: Standards Press of China, 2006. (in Chinese)

[23]
国家市场监督管理总局, 国家标准化管理委员会. 饲料中中性洗涤纤维(NDF)的测定:GB/T 20806—2022[S]. 北京: 中国标准出版社, 2022.

State Administration for Market Regulation, Standardization Administration of the People’s Republic of China. Determination of neutral detergent fiber (NDF) in feeds:GB/T 20806—2022[S]. Beijing: Standards Press of China, 2022. (in Chinese)

[24]
中华人民共和国农业部. 饲料中酸性洗涤纤维的测定:NY/T 1459—2007[S]. 北京: 农业出版社, 2007.

Ministry of Agriculture and Rural Affairs of the People’s Republic of China. Determination of acid detergent fiber in feedstuff(ADF):NY/T 1459—2007[S]. Beijing: China Agriculture Press, 2007. (in Chinese)

[25]
国家市场监督管理总局, 中国国家标准化管理委员会. 动物饲料中淀粉含量的测定旋光法:GB/T 20194—2018[S]. 北京: 中国标准出版社, 2018.

State Administration for Market Regulation, Standardization Administration of the People’s Republic of China. Determination of starch in feeds-polarimetry:GB/T 20194—2018[S]. Beijing: Standards Press of China, 2018. (in Chinese)

[26]
李军涛. 近红外反射光谱快速评定玉米和小麦营养价值的研究[D].博士学位论文. 北京: 中国农业大学, 2014.

LI J T. Study on the rapid evaluation of nutrient values of corn and wheat by near-infrared reflectance spectroscopy[D].Ph.D.Thesis. Beijing: China Agricultural University, 2014. (in Chinese)

[27]
CHEN G L, ZHANG B, WU J G, et al. Nondestructive assessment of amino acid composition in rapeseed meal based on intact seeds by near-infrared reflectance spectroscopy[J]. Animal Feed Science and Technology, 2011, 165(1/2):111-119.

[28]
YIN H, MO W L, LI L Q, et al. Near-infrared spectroscopy analysis of the phytic acid content in fuzzy cottonseed based on machine learning algorithms[J]. Foods, 2024, 13(10):1584.

[29]
冯豆, 蔡阿敏, 薛宵, 等. 花生秧常规营养成分近红外反射光谱预测模型的建立[J]. 动物营养学报, 2019, 31(1):452-458.

FENG D, CAI A M, XUE X, et al. Prediction model establishment for routine nutrient of peanut vine by near-infrared reflectance spectroscopy[J]. Chinese Journal of Animal Nutrition, 2019, 31(1):452-458. (in Chinese)

[30]
QUAMPAH A, HUANG Z R, WU J G, et al. Estimation of oil content and fatty acid composition in cottonseed kernel powder using near infrared reflectance spectroscopy[J]. Journal of the American Oil Chemists Society, 2012, 89(4):567-575.

[31]
李玉鹏, 李海花, 朱琪, 等. 近红外光谱分析技术及其在饲料中的应用[J]. 中国饲料, 2017(4):22-26.

LI Y P, LI H H, ZHU Q, et al. Application of near infrared reflectance spectroscopy in feed[J]. China Feed, 2017(4):22-26. (in Chinese)

[32]
何可可, 陈雅坤, 邱庆, 等. 近红外光谱分析技术在玉米青贮饲料检测中的研究进展[J]. 中国饲料, 2024(17):117-121.

HE K K, CHEN Y K, QIU Q, et al. Research progress of near-infrared spectroscopy in the detection of corn silage[J]. China Feed, 2024(17):117-121. (in Chinese)

[33]
陈菲, 李小梅, 倪奎奎, 等. 近红外光谱技术在青贮饲料品质检测中的研究进展[J]. 中国饲料, 2021(23):78-83.

CHEN F, LI X M, NI K K, et al. Research progress of silage nondestructive detection based on near-infrared spectroscopy technology[J]. China Feed, 2021(23):78-83. (in Chinese)

[34]
LI M, HE S Y, WANG J, et al. An NIRS-based assay of chemical composition and biomass digestibility for rapid selection of Jerusalem artichoke clones[J]. Biotechnology for Biofuels, 2018,11:334.

[35]
LOBOS I, MOSCOSO C J, PAVEZ P. Calibration models for the nutritional quality of fresh pastures by near-infrared reflectance spectroscopy[J]. Ciencia e Investigacion Agraria, 2019, 46(3):234-242.

[36]
刘强, 孟庆翔, 白琪林, 等. 利用近红外光谱法快速测定青贮玉米饲料中NDF与ADF含量[J]. 中国畜牧杂志, 2005, 41(11):39-41.

LIU Q, MENG Q X, BAI Q L, et al. Rapid determination of NDF and ADF in corn stalk silage using near infrared reflectance spectroscopy[J]. Chinese Journal of Animal Science, 2005, 41(11):39-41. (in Chinese)

[37]
唐德富, 陈志刚, 李飞, 等. 青贮玉米不同部位(组织)养分含量近红外预测模型的构建[J]. 草业科学, 2021, 38(9):1753-1761.

TANG D F, CHEN Z G, LI F, et al. Construction of a near-infrared prediction model for nutrient content in different parts (tissues) of corn silage[J]. Pratacultural Science, 2021, 38(9):1753-1761. (in Chinese)

[38]
OLUK A C, YUCEL C, CAKIR B, et al. Calibrations using near-infrared spectroscopy to determine the nutritional content and chemical composition of hay and silage of pearl millet[J]. Comptesrendus de L’academie Bulgare des Sciences, 2025, 78(2):309-318.

[39]
郭丽丽. 便携式近红外仪在反刍动物饲料质量分析中的应用研究[D].硕士学位论文. 北京: 中国农业科学院, 2021.

GUO L L. Study on feed quality analysis of ruminants by portable near infrared spectrometer[D].Master’s Thesis. Beijing: Chinese Academy of Agricultural Sciences, 2021. (in Chinese)

[40]
ZOU N C, ZHANG R, WU Y T, et al. Model exploration and application of near-infrared spectroscopy for species separation and quantification during mixed litter decomposition in subtropical forests of China[J]. Forests, 2024, 15(4):637.

[41]
曹明月, 郑爱荣, 娄渊志, 等. 奶牛全混合日粮常规营养成分含量近红外快速检测模型的构建与应用[J]. 动物营养学报, 2020, 32(7):3420-3427.

DOI

CAO M Y, ZHENG A R, LOU Y Z, et al. Construction and application of near infrared reflectance spectroscope rapid detection model for routine nutritional components contents of total mixed ration in dairy cattle[J]. Chinese Journal of Animal Nutrition, 2020, 32(7):3420-3427. (in Chinese)

[42]
白琪林. 青贮玉米秸秆品质性状遗传及其近红外测定方法的研究[D].博士学位论文. 北京: 中国农业大学, 2005.

BAI Q L. In heritance of stover quality traits and their determination by near-infrared reflectance spectroscopy (NIRS) in silage maize (Zea may L.)[D].Ph.D.Thesis. Beijing: China Agricultural University, 2005. (in Chinese)

[43]
DIAS C S A M M, NUNES H P B, BORBA A E S. Influence of the physical properties of samples in the use of NIRS to predict the chemical composition and gas production kinetic parameters of corn and grass silages[J]. Fermentation, 2023, 9(5):418.

[44]
刘玉琴, 曲永利, 赵连生, 等. 全株玉米青贮主要营养成分相关性分析[J]. 中国草地学报, 2020, 42(6):165-170.

LIU Y Q, QU Y L, ZHAO L S, et al. Correlation analysis of main nutrient components of whole maize silages[J]. Chinese Journal of Grassland, 2020, 42(6):165-170. (in Chinese)

[45]
RENNER I E, FRITZ V A. Using near-infrared reflectance spectroscopy (NIRS) to predict glucobrassicin concentrations in cabbage and Brussels sprout leaf tissue[J]. Plant Methods, 2020,16:136.

[46]
LI L L, LI L, GOU G Y, et al. A nondestructive detection method for the muti-quality attributes of oats using near-infrared spectroscopy[J]. Foods, 2024, 13(22):3560.

Outlines

/