

1 材料与方法
1.1 试验材料
1.2 试验设计与饲养管理
表1 饲粮组成及营养水平(干物质基础)Table 1 Composition and nutrient levels of the diet (DM basis)% |
| 项目Items | 含量Content | ||
|---|---|---|---|
| 原料Ingredients | |||
| 玉米Corn | 30.01 | ||
| 大麦Barley | 10.87 | ||
| 麸皮Wheat bran | 8.72 | ||
| 豆粕Soybean meal | 12.50 | ||
| 棉籽粕Cottonseed meal | 3.00 | ||
| 预混料Premix1) | 2.00 | ||
| 碳酸氢钠NaHCO3 | 0.70 | ||
| 氧化镁MgO | 0.20 | ||
| 碳酸钙CaCO3 | 0.50 | ||
| 食盐NaCl | 0.50 | ||
| 甜菜糖蜜Beet molasses | 1.00 | ||
| 苜蓿Alfalfa | 30.00 | ||
| 合计Total | 100.00 | ||
| 营养水平Nutrients levels2) | |||
| 干物质(风干基础) DM (air-dry basis) | 94.82 | ||
| 代谢能ME/(MJ/kg) | 11.05 | ||
| 粗蛋白质CP | 14.82 | ||
| 酸性洗涤纤维ADF | 6.81 | ||
| 中性洗涤纤维NDF | 23.93 | ||
| 钙Ca | 0.33 | ||
| 总磷TP | 0.31 |
1)每千克预混料含有 One kg of premix contained the following:FeSO4·H2O 10 g,CuSO4·5H2O 3.97 g,CoSO4·H2O 33 mg,KIO3 1.5 g,MnSO4·H2O 20.34 g,ZnSO4·H2O 14.1 g,NaSeO3 0.5 g,VA 156 666.7 IU,VE 2 133.333 IU。 2)代谢能通过《中国饲料成分及营养价值表(2024年第35版)》中饲料原料的代谢能及其在饲粮配方中的质量百分比计算得出,其余为实测值。ME was calculated based on the ME of feed raw materials in Tables of Feed Composition and Nutritive Values in China (35th Edition, 2024) and their mass percentage in the dietary formula, while the others were measured values. |
1.3 样品采集与处理
1.3.1 外周血采集
1.3.2 瘤胃组织样采集
1.4 饲粮营养成分的测定
1.5 血液指标的测定
1.6 miRNA文库构建及测序
1.6.1 瘤胃组织总RNA的提取
1.6.2 文库构建
1.6.3 文库质控与测序
1.6.4 测序数据处理
1.7 小RNA分类注释与miRNA分析
1.7.1 小RNA分类注释
1.7.2 与参考基因组比对
1.7.3 miRNA分析
1.8 miRNA表达量分析
1.9 差异表达miRNA分析与靶基因预测
1.9.1 差异表达miRNA筛选与聚类分析
1.9.2 靶基因预测
1.9.3 miRNA靶基因KEGG注释
1.10 加权共表达网络分析
1.11 数据分析
2 结果与分析
2.1 生长发育相关表型指标测定结果
表2 不同生长阶段呼伦贝尔羊生长发育相关表型指标Table 2 Phenotype indicators related to growth and development of Hulunbuir sheep at different growth stages |
| 项目 Items | 生长阶段Growth stages | |||
|---|---|---|---|---|
| 3月龄M3 | 5月龄M5 | 6月龄M6 | 8月龄M8 | |
| 体重Body weight/kg | 18.60±1.15c | 25.69±2.30b | 32.60±1.00a | 32.43±3.15a |
| 外周血中游离氨基酸含量Free amino acid contents in peripheral blood/(μg/mL) | ||||
| 天冬氨酸Asp | 5.10±3.41 | 5.94±2.43 | 5.50±1.32 | 4.02±1.47 |
| 苏氨酸Thr | 34.55±14.16 | 43.43±12.94 | 43.28±11.33 | 36.04±7.20 |
| 丝氨酸Ser | 8.77±3.69 | 10.36±2.94 | 10.56±2.79 | 7.31±1.89 |
| 谷氨酸Glu | 42.17±15.81 | 46.21±15.54 | 52.63±9.88 | 36.54±14.48 |
| 甘氨酸Gly | 61.21±24.85a | 54.54±19.75ab | 48.95±9.37ab | 33.67±4.90b |
| 丙氨酸Ala | 17.20±5.72 | 21.36±3.39 | 20.13±3.98 | 20.14±4.23 |
| 半胱氨酸Cys | 3.85±3.32 | 2.07±0.71 | 1.84±0.36 | 2.28±0.35 |
| 缬氨酸Val | 26.72±11.88 | 26.38±5.30 | 31.07±9.19 | 23.12±6.23 |
| 蛋氨酸Met | 3.16±1.31 | 3.44±1.10 | 3.67±0.80 | 2.96±0.77 |
| 异亮氨酸Ile | 12.87±7.04 | 12.02±3.52 | 11.77±3.86 | 9.86±2.13 |
| 亮氨酸Leu | 20.02±8.88 | 18.95±4.27 | 19.97±3.60 | 16.30±3.33 |
| 酪氨酸Tyr | 11.07±5.94 | 14.86±4.90 | 15.19±3.52 | 12.87±3.13 |
| 苯丙氨酸Phe | 8.46±2.76 | 9.95±2.10 | 10.36±2.01 | 8.94±1.64 |
| 赖氨酸Lys | 25.17±9.81 | 26.88±6.78 | 25.03±3.23 | 20.05±6.03 |
| 组氨酸His | 8.60±2.84 | 9.11±2.18 | 8.69±1.78 | 7.10±1.23 |
| 精氨酸Arg | 22.15±10.17 | 24.00±6.96 | 23.36±7.22 | 16.71±5.75 |
| 脯氨酸Pro | 11.92±4.10 | 11.89±2.40 | 11.91±2.09 | 9.29±1.52 |
| 外周血中激素类含量Hormone contents in peripheral blood | ||||
| 生长激素GH/(ng/mL) | 9.23±2.60 | 10.67±1.40 | 11.43±1.79 | 10.50±1.61 |
| 胰岛素INS/(μIU/mL) | 33.00±9.59 | 27.19±7.08 | 29.56±4.67 | 31.81±9.20 |
| 胰岛素样生长因子-1 IGF-1/(ng/mL) | 1 120.01±271.74 | 979.99±117.46 | 1 202.09±175.38 | 1 161.43±207.41 |
| 胰高血糖素样肽GLP/(ng/mL) | 12.09±2.24 | 12.26±1.53 | 12.55±2.02 | 11.71±1.96 |
| 外周血中免疫球蛋白含量Immunoglobulin contents in peripheral blood | ||||
| 免疫球蛋白A IgA/(μg/mL) | 437.90±54.88 | 439.64±42.35 | 439.55±21.69 | 449.65±46.78 |
| 免疫球蛋白M IgM/(μg/mL) | 2 006.51±343.88 | 2 015.70±359.77 | 1 961.53±400.34 | 1 931.54±196.63 |
| 免疫球蛋白G IgG/(mg/mL) | 48.66±14.01 | 55.39±10.75 | 53.09±6.03 | 53.52±10.78 |
| 外周血中非酯化脂肪酸含量 NEFA content in peripheral blood/(ng/mL) | 14.72±3.59 | 12.51±1.68 | 13.60±3.26 | 15.96±3.39 |
同行数据肩标不同小写字母表示差异显著(P<0.05)。 | |
Values with different lowercase letter superscripts in the same line indicated significant difference (P<0.05). |
2.2 瘤胃上皮组织miRNA鉴定
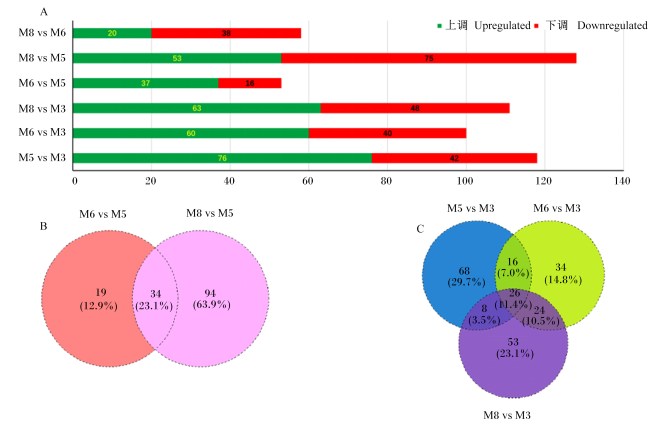
图1 不同生长阶段呼伦贝尔羊瘤胃组织中的差异表达miRNAM3:3月龄;M5:5月龄;M6:6月龄;M8:8月龄。下图同。M3: 3 months of age; M5: 5 months of age; M6: 6 months of age; M8: 8 months of age. The same as below. A:4个生长阶段的两两比较中差异表达miRNA的数量;B:与M5阶段相比,M6和M8阶段共同存在的差异表达miRNA数量和比例;C:与M3阶段相比,在M5、M6和M8阶段共同存在的差异表达miRNA的数量和比例。A: the number of differentially expressed miRNA in pairwise comparisons among the four growth stages; B: the number and proportion of differentially expressed miRNA co-existing in stages M6 and M8 compared with stage M5; C: the number and proportion of differentially expressed miRNA co-existing in stages M5, M6 and M8 compared with stage M3. Fig.1 Differentially expressed miRNA in rumen tissue of Hulunbuir sheep at different growth stages |
2.3 差异表达miRNA的聚类分析
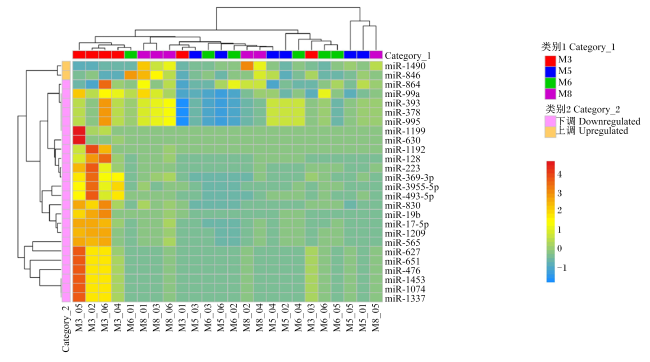
2.4 差异表达miRNA靶基因的KEGG通路富集分析
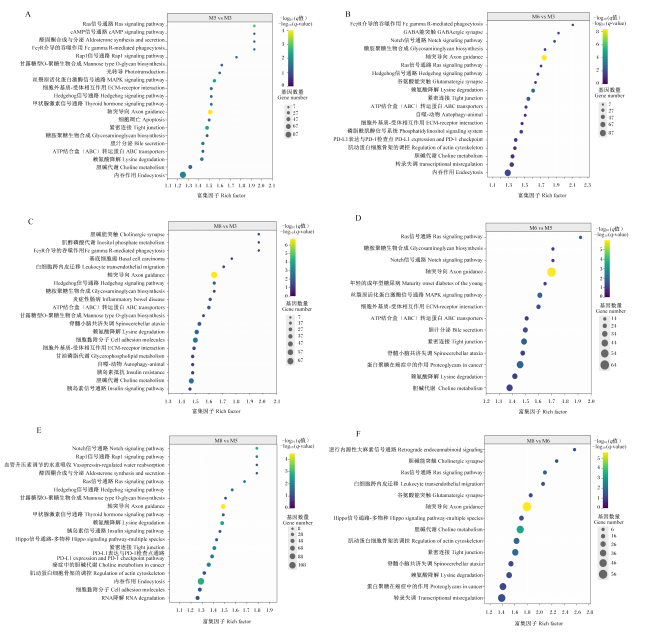
图3 不同生长阶段的呼伦贝尔羊瘤胃组织中差异表达miRNA的KEGG通路富集分析A: M5与M3阶段差异表达miRNA富集通路;B:M6与M3阶段差异表达miRNA富集通路;C:M8与M3阶段差异表达miRNA富集通路;D:M6与M5阶段差异表达miRNA富集通路;E:M8与M5阶段差异表达miRNA富集通路;F:M8与M6阶段差异表达miRNA富集通路。 Fig.3 KEGG pathway enrichment of differentially expressed miRNA in rumen tissue of Hulunbuir sheep at different growth stages A: differentially expressed miRNA enrichment pathway of stage M5 compared with stage M3; B: differentially expressed miRNA enrichment pathway of stage M6 compared with stage M3; C: differentially expressed miRNA enrichment pathway of stage M8 compared with stage M3; D: differentially expressed miRNA enrichment pathway of stage M6 compared with stage M5; E: differentially expressed miRNA enrichment pathway of stage M8 compared with stage M5; F: differentially expressed miRNA enrichment pathway of stage M8 compared with stage M6. |
2.5 加权共表达网络分析
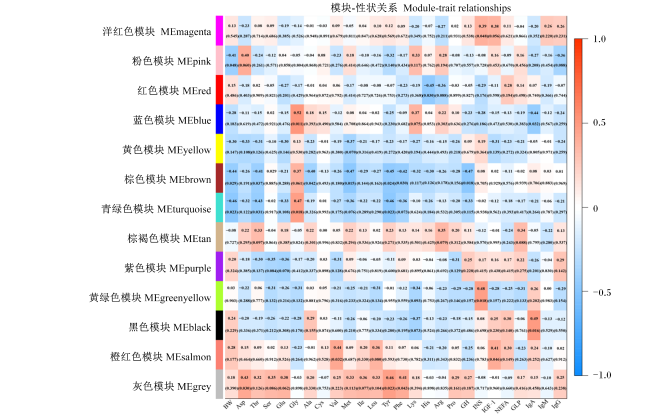
图4 不同生长阶段呼伦贝尔羊瘤胃组织中差异表达基因miRNA的加权基因共表达各模块与表型数据的关系BW:体重 body weight;Asp:天冬氨酸 aspartic acid;Thr:苏氨酸 threonine;Ser:丝氨酸 serine;Glu:谷氨酸 glutamic acid;Gly:甘氨酸 glycine;Ala:丙氨酸 alanine;Cys:半胱氨酸 cysteine;Val:缬氨酸 valine;Met:蛋氨酸 methionine;Ile:异亮氨酸 isoleucine;Leu:亮氨酸 leucine;Tyr:酪氨酸 tyrosine;Phe:苯丙氨酸 phenylalanine;Lys:赖氨酸 lysine;His:组氨酸 histidine;Arg:精氨酸 arginine;Pro:脯氨酸 proline;GH:生长激素 growth hormone;INS:胰岛素 insulin;IGF-1:胰岛素样生长因子-1 insulin-like growth factor-1;NEFA:非酯化脂肪酸 non-esterified fatty acid;GLP:胰高血糖素样肽 glucagon-like peptide;IgA:免疫球蛋白A immunoglobulin A;IgM:免疫球蛋白M immunoglobulin M;IgG:免疫球蛋白G immunoglobulin G。 Fig.4 Relationship between weighted gene co-expression modules of differentially expressed miRNA in rumen tissue and phenotypic data of Hulunbuir sheep at different growth stages |
2.6 表型相关miRNA的表达量
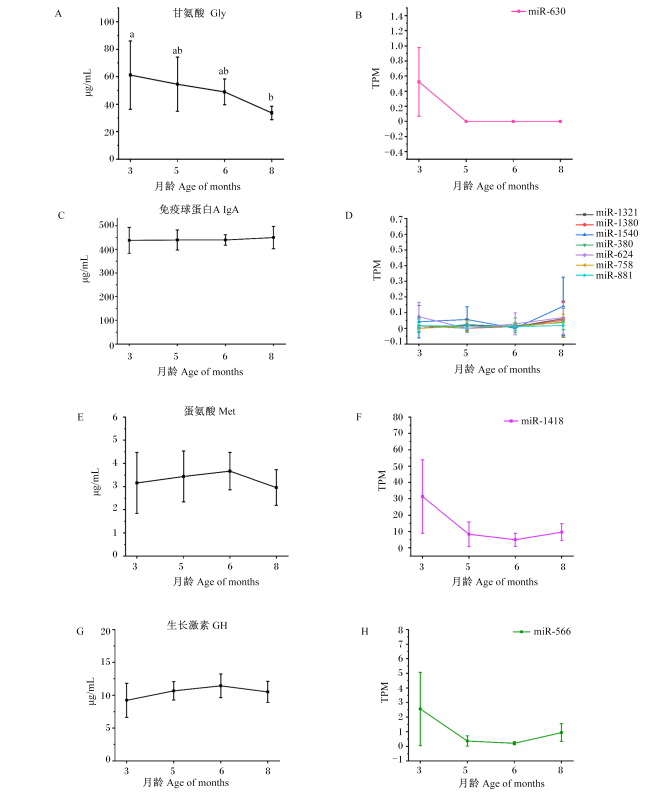


图5 不同生长阶段的呼伦贝尔羊相关表型及其相关miRNA的表达量的变化A:外周血中Gly含量的变化;B:与外周血中Gly含量呈正相关的miRNA的表达量;C:外周血中IgA含量的变化;D:与外周血中IgA含量呈正相关的miRNA的表达量;E:外周血中Met含量的变化;F:与外周血中Met含量呈负相关的miRNA的表达量;G:外周血中GH含量的变化;H:与外周血中GH含量呈负相关的miRNA的表达量。数据点标注不同小写字母表示差异显著(P<0.05)。 Fig.5 Changes in phenotypes related to Hulunbuir sheep at different growth stages and expression levels of their associated miRNA A: the change of Gly content in peripheral blood; B: the expression level of miRNA positively correlated with Gly content in peripheral blood; C: the change of IgA content in peripheral blood; D: the expression level of miRNA positively correlated with IgA content in peripheral blood; E: the change of Met content in peripheral blood; F: the expression levels of miRNA negatively correlated with Met content in peripheral blood; G: the change of GH content in peripheral blood; H: the expression level of miRNA negatively correlated with GH content in peripheral blood. Data points labeled with different lowercase letters indicated significant difference (P<0.05). |