1 材料与方法
1.1 菌株与质粒
1.2 主要试剂
1.3 基因序列分析与重组载体的构建
1.3.1 基因序列分析
1.3.2 重组载体的构建
1.4 重组蛋白的诱导表达与纯化
1.5 酶活性的测定
1.6 酶学性质分析
1.6.1 最适pH及pH稳定性
1.6.2 最适温度及温度稳定性
1.6.3 金属离子及金属离子螯合剂对酶活性的影响
1.6.4 底物特异性
1.6.5 动力学参数
1.7 数据处理
2 结果与分析
2.1 生物信息学分析与重组载体的构建
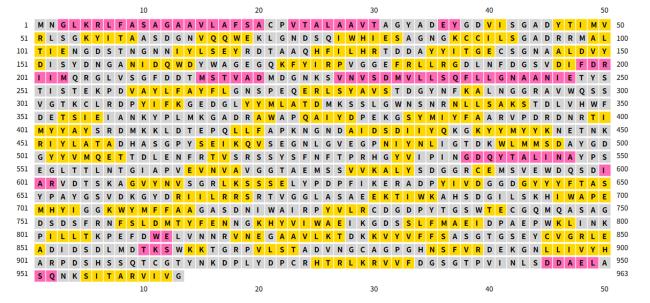
图1 PSIPRED预测的α-Ara蛋白质二级结构粉色表示α-螺旋;黄色表示β-折叠;灰色表示无规卷曲。Pink indicated α-helix; yellow indicated β-strand; gray indicated random coil. M:甲硫氨酸 methionine;G:甘氨酸 glycine;L:亮氨酸 leucine;K:赖氨酸 lysine;R:精氨酸 arginine;F:苯丙氨酸 phenylalanine;A:丙氨酸 alanine;S:丝氨酸 serine;V:缬氨酸 valine;C:半胱氨酸 cysteine;P:脯氨酸 proline;T:苏氨酸 threonine;Y:酪氨酸 tyrosine;I:异亮氨酸 isoleucine;Q:谷氨酰胺 glutamine;W:色氨酸 tryptophan;E:谷氨酸 glutamic acid;D:天冬氨酸 aspartic acid;N:天冬酰胺 asparagine;H:组氨酸 histidine。图2同 The same as Fig.2。 Fig.1 α-Ara protein secondary structure predicted by PSIPRED |
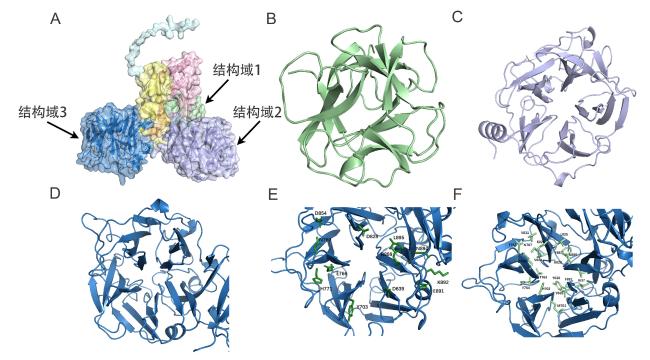
图2 SWISS-MODEL预测的α-Ara蛋白质三维结构及其催化结构域图A为预测的蛋白质三维结构,其中黄色和粉色部分为预测的非催化结构域,绿色、紫色和蓝色部分分别为预测的催化结构域1、催化结构域2和催化结构域3;图B为预测的催化结构域1(对应A图中绿色部分);图C为预测的催化结构域2(对应A图中紫色部分);图D为预测的催化结构域3(对应A图中蓝色部分);图E为催化结构域3外侧结构(由12个氨基酸残基组成);图F为催化结构域3内侧结构(由18个氨基酸残基组成)。 Fig.2 α-Ara protein three-dimensional structure and catalytic domains predicted by SWISS-MODEL Figure A showed the predicted protein three-dimensional structure, where the yellow and pink regions represented the predicted non-catalytic domains, and the green, purple and blue regions represented the predicted catalytic domain 1, catalytic domain 2 and catalytic domain 3, respectively; figure B showed the predicted catalytic domain 1 (corresponding to the green region in figure A); figure C showed the predicted catalytic domain 2 (corresponding to the purple region in figure A); figure D presented the predicted catalytic domain 3 (corresponding to the blue region in figure A); figure E showed the outer structure of catalytic domain 3 (composed of 12 amino acid residues); figure F showed the inner structure of catalytic domain 3 (composed of 18 amino acid residues). |
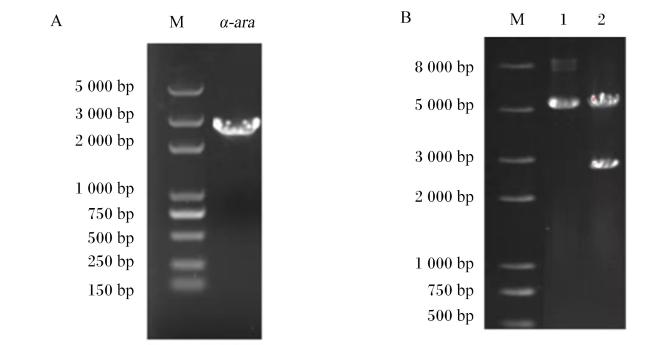
图3 α-ara基因PCR扩增产物(A)及重组质粒酶切产物(B)琼脂糖凝胶电泳结果图A中,M代表D5000 DNA marker,α-ara代表α-ara基因;图B中,M代表D8000 DNA marker,1代表重组质粒,2代表重组质粒酶切产物。 Fig.3 Agarose gel electrophoresis results of PCR amplification product of α-ara gene (A) and restriction enzyme digestion product of recombinant plasmid (B) In figure A, M represented D5000 DNA marker and α-ara represented α-ara gene; in figure B, M represented D8000 DNA marker, 1 represented recombinant plasmid and 2 represented digestion product of recombinant plasmid. |
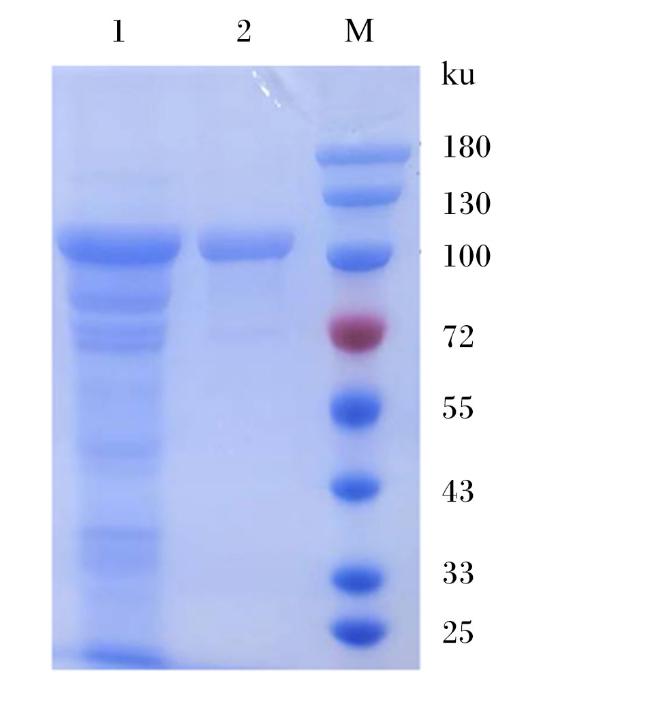
2.2 重组蛋白的诱导表达与纯化
2.3 酶学性质分析
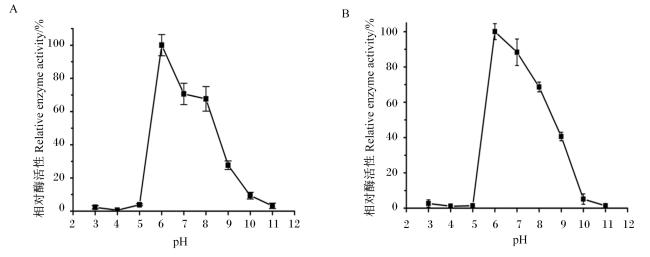
2.3.1 最适pH及pH稳定性
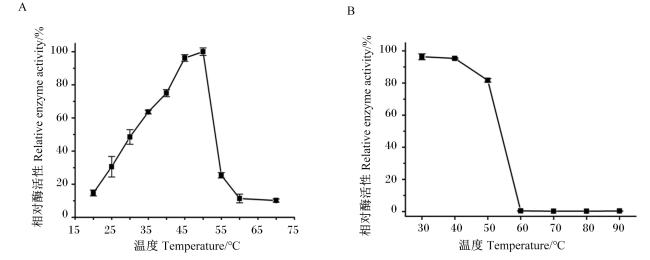
2.3.2 最适温度及温度稳定性
2.3.3 金属离子及EDTA对酶活性的影响
表1 金属离子及EDTA对α-Ara酶活性的影响Table 1 Effects of metal ions and EDTA on enzymatic activity of α-Ara % |
| 项目 Items | 相对酶活性Relative enzyme activity | |
|---|---|---|
| 1 mmol/L | 10 mmol/L | |
| 对照Control | 100.00±5.04 | 100.00±6.46 |
| 镁离子Mg2+ | 147.42±6.14 | 128.07±9.44 |
| 钾离子K+ | 134.69±1.72 | 159.92±14.90 |
| 钴离子Co2+ | 158.96±12.84 | 119.60±11.24 |
| 钠离子Na+ | 132.32±7.64 | 145.79±5.24 |
| 铜离子Cu2+ | 22.20±2.58 | 13.68±4.62 |
| 镍离子Ni2+ | 74.62±6.25 | 34.24±5.43 |
| 锰离子Mn2+ | 165.41±9.43 | 109.36±7.68 |
| 钡离子Ba2+ | 122.76±2.66 | 149.89±10.44 |
| 锌离子Zn2+ | 33.85±5.67 | 31.72±5.05 |
| 钙离子Ca2+ | 108.08±2.50 | 51.27±6.96 |
| 铁离子Fe3+ | 113.25±10.47 | 23.27±2.48 |
| 乙二胺四乙酸EDTA | 46.56±2.40 | 26.98±5.27 |
2.3.4 底物特异性
表2 α-Ara对不同底物的酶比活性Table 2 Enzymatic specific activity of α-Ara against different substrates U/mg |
| 底物Substrates | 酶比活性Enzyme specific activity |
|---|---|
| 对硝基苯-α-L-阿拉伯呋喃糖苷pNP-α-L-Araf | 8.760±0.430 |
| 对硝基苯-β-D-半乳糖苷pNP-β-D-Gal | 5.800±0.330 |
| 对硝基苯-α-L-阿拉伯吡喃糖苷pNP-α-L-Arap | 0.043±0.002 |
| 对硝基苯-α-D-半乳糖苷pNP-α-D-Gal | 0.017±0.001 |
| 对硝基苯-β-D-木糖苷pNP-β-D-Xyl | - |
| 对硝基苯-β-D-葡萄糖苷pNP-β-D-Glc | - |
| 对硝基苯-α-D-甘露糖苷pNP-α-D-Man | - |
| 对硝基苯-α-L-岩藻糖苷pNP-α-L-Fuc | - |