

1 材料与方法
1.1 试验材料
1.2 试验设计
表1 常乳营养水平Table 1 Normal milk nutrient levels % |
| 项目Items | 含量Content |
|---|---|
| 乳蛋白Milk protein | 3.52 |
| 乳脂Milk fat | 4.43 |
| 乳糖Lactose | 4.56 |
| 总固形物Total solid | 13.40 |
实测值 Measured values。 |
表2 基础饲粮组成及营养水平(干物质基础)Table 2 Composition and nutrient levels of the basal diet (DM basis) % |
| 项目Items | 含量Content | |
|---|---|---|
| 原料Ingredients | ||
| 玉米Corn | 52.70 | |
| 豆粕Soybean meal | 19.00 | |
| 膨化大豆Extruded soybean | 8.00 | |
| 棉籽粕Cottonseed meal | 6.00 | |
| 麸皮Wheat bran | 7.00 | |
| 干酒糟及其可溶物DDGS | 3.00 | |
| 石粉Limestone | 1.30 | |
| 食盐NaCl | 0.50 | |
| 磷酸氢钙CaHPO4 | 0.50 | |
| 预混料Premix1) | 2.00 | |
| 合计Total | 100.00 | |
| 营养水平Nutrient levels2) | ||
| 干物质(风干基础) DM (air-dry basis) | 93.58 | |
| 粗蛋白质CP | 18.61 | |
| 中性洗涤纤维NDF | 28.86 | |
| 酸性洗涤纤维ADF | 16.92 | |
| 粗灰分Ash | 6.49 | |
| 粗脂肪EE | 3.38 | |
| 钙Ca | 1.05 | |
| 磷P | 0.54 |
1)预混料为每千克饲粮提供 The premix provided the following per kg of the diet: VA 7 500 IU,VD 1 000 IU,VE 100 IU,Fe 90 mg,Cu 12.5 mg,Mn 30 mg,Zn 90 mg,Se 0.3 mg,I 1.0 mg,Co 0.5 mg。 | |
2)实测值 Measured values。 |
1.3 饲养管理
1.4 测定指标
1.4.1 常乳和饲粮营养水平
1.4.2 血清IgG含量
1.4.3 生长性能
1.4.4 发病率
1.4.5 肠道菌群
1.5 数据统计分析
2 结果
2.1 冬虫夏草菌丝体发酵培养物残渣对荷斯坦犊牛生长性能的影响
表3 冬虫夏草菌丝体发酵培养物残渣对荷斯坦犊牛生长性能的影响Table 3 Effects of Cordyceps militaris mycelium fermentation culture residue on growth performance of Holstein calves |
| 项目 Items | 对照组 Control group | 试验组 Experimental group | SEM | P值 P-value |
|---|---|---|---|---|
| 初始体重IBW/kg | 38.37 | 37.87 | 0.296 | 0.401 |
| 终末体重FBW/kg | 107.50 | 110.70 | 2.308 | 0.498 |
| 平均日增重ADG/(kg/d) | 0.77 | 0.81 | 0.051 | 0.443 |
2.2 冬虫夏草菌丝体发酵培养物残渣对荷斯坦犊牛发病率的影响
表4 冬虫夏草菌丝体发酵培养物残渣对荷斯坦犊牛发病率的影响Table 4 Effects of Cordyceps militaris mycelium fermentation culture residue on disease incidence rates of Holstein calves |
| 项目 Items | 对照组 Control group | 试验组 Experimental group | SEM | P值 P-value |
|---|---|---|---|---|
| 腹泻发病率Diarrhea incidence rate/% | 33.33 | 26.67 | ||
| 感冒发病率Cold incidence rate/% | 40.00 | 26.67 | ||
| 感冒评分Cold score | 6.03 | 5.55 | 0.220 | 0.058 |
2.3 冬虫夏草菌丝体发酵培养物残渣对荷斯坦犊牛肠道菌群的影响
2.3.1 对照组和试验组Alpha多样性和Beta多样性分析
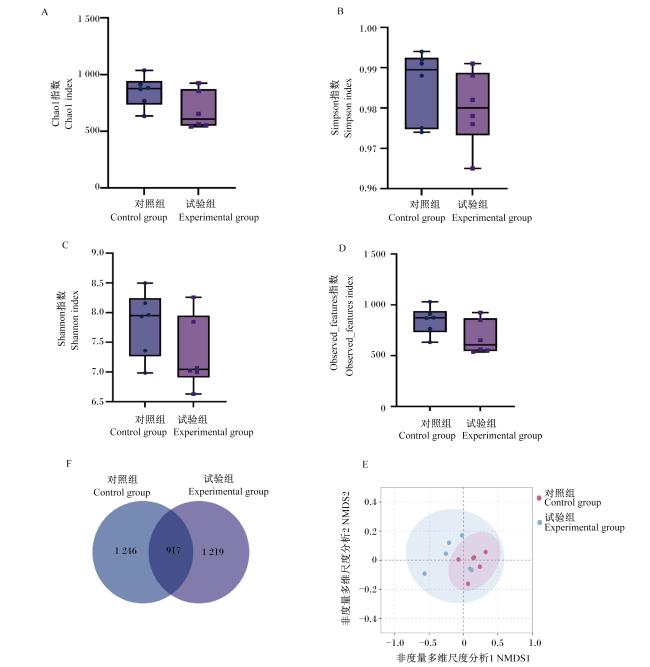
图1 对照组和试验组Alpha多样性和Beta多样性分析数据柱标无字母表示差异不显著(P>0.05)。Value columns with no letter superscripts mean no significant difference (P>0.05). Fig.1 Alpha diversity and Beta diversity analyze between control group and experimental group A:Chao1指数;B:Simpson指数;C:Shannon指数;D:Observed_features指数;E:基于Bray-Curtis距离的NMDS分析;F:差异ASV韦恩图。A: Chao1 index; B: Simpson index; C: Shannon index; D: Observed_features index; E: NMDS analysis based on Bray-Curtis distance; F: Venn diagram of differences in ASV。 |
2.3.2 对照组和试验组差异微生物分析和微生物网路分析
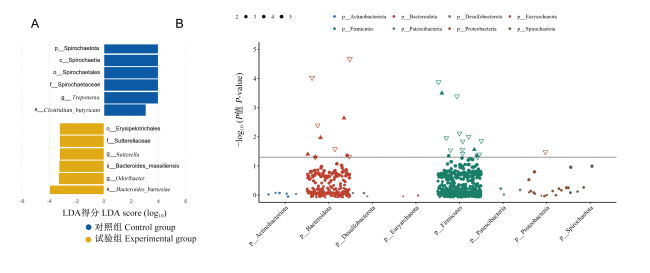
图2 对照组和试验组的差异微生物分析A:LDA分布柱形图(LDA得分>3,P<0.05)。B:门水平差异ASV曼哈顿图。差异丰度分析使用DESeq2进行。FDR<0.05且|log2FC|≥1的ASV被认为具有显著差异。图中实心上三角表示试验组与对照组相比显著上调的ASV,空心倒三角表示试验组与对照组相比显著下调的ASV。A: LDA distribution bar chart (LDA score>3, P<0.05). B: phylum-level differential ASV Manhattan plot. Differential abundance analysis was performed using DESeq2. ASV with FDR<0.05 and |log2FC|≥1 was considered significantly different. In the plot, the solid upward triangles represented ASV significantly up-regulated in the experimental group compared with the control group, while the open downward triangles represented ASV significantly down-regulated in the experimental group compared with the control group. Spirochaetota:螺旋体门;Spirochaetia:螺旋体纲;Spirochaetales:螺旋体目;Erysipelotrichales:毒丝菌目;Spirochaetaceae:螺旋体科;Sutterellaceae:苏特雷菌科;Treponema:密螺旋体属;Sutterella:苏特雷菌属;Odoribacter:恶臭杆菌属;Clostridium butyricum:丁酸梭菌;Bacteroides massiliensis:马赛拟杆菌;Bacteroides barnesiae:巴恩斯拟杆菌。 Fig.2 Differential microbial analysis between control group and experimental group |
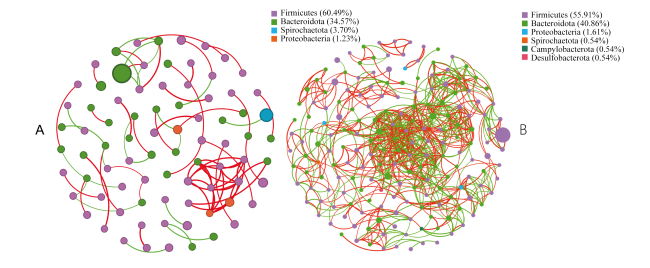
图3 对照组和试验组微生物网络分析A:对照组门水平微生物网络图(节点:81;边:76;正相关:71.05%;负相关:28.95%;模块度:0.884;群落数量:28)。B:试验组门水平微生物网络图(节点:186;边:191;正相关:55.88%;负相关:44.12%;模块度:0.627;群落数量:15)。A: microbial network diagram at phylum level of the control group (nodes: 81; edges: 76; positive correlation: 71.05%; negative correlation: 28.95%; modularity: 0.884; number of communities: 28); B: microbial network diagram at phylum level of the experimental group (nodes: 186; edges: 191; positive correlation: 55.88%; negative correlation: 44.12%; modularity: 0.627; number of communities: 15). Firmicutes:厚壁菌门;Bacteroidota:拟杆菌门;Spirochaetota:螺旋体门;Proteobacteria:变形菌门;Campylobacterota:弯曲杆菌门;Desulfobacterota:脱硫杆菌门。 Fig.3 Microbial network analysis of control group and experimental group |
2.3.3 PICRUSt2微生物功能预测
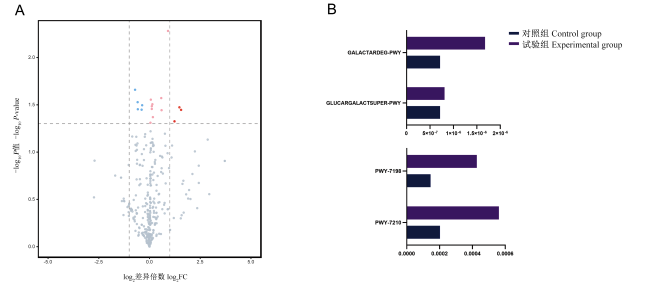


图4 对照组和试验组微生物功能预测A:功能通路功能差异富集火山图;以P<0.05且|log2FC|>1为显著差异筛选阈值,其中红色实心圆点代表试验组相较于对照组显著上调的功能通路。B:差异富集功能通路。 Fig.4 Microbial function prediction of control group and experimental group A: Functional pathways differential enrichment volcano plot; the significant difference screening threshold of P<0.05 and |log2FC|>1, the red solid dots represent the functional pathways significantly up-regulated in the experimental group compared with the control group. B: differentially enriched functional pathways. |