

1 材料与方法
1.1 试验动物选择及分组
1.2 试验设计
1.3 饲养管理
表1 围产期饲粮组成及营养水平(风干基础)Table 1 Composition and nutrient levels of the periparturient diet (air-dry basis) |
| 项目 Items | 含量 Content |
|---|---|
| 原料 Ingredients | |
| 全株玉米青贮 Whole plant corn silage | 6.00 |
| 苜蓿干草 Alfalfa hay | 16.00 |
| 燕麦草 Oat hay | 38.00 |
| 玉米 Corn | 22.00 |
| 豆粕 Soybean meal | 10.00 |
| 麸皮 Wheat bran | 5.50 |
| 石粉 Limestone | 0.50 |
| 小苏打 NaHCO3 | 0.50 |
| 氯化钠 NaCl | 0.50 |
| 预混料 Premix1) | 1.00 |
| 合计 Total | 100.00 |
| 营养水平 Nutrient levels2) | |
| 消化能 DE/(MJ/kg) | 13.24 |
| 干物质 DM | 85.68 |
| 粗蛋白质 CP | 13.33 |
| 中性洗涤纤维 NDF | 37.20 |
| 酸性洗涤纤维 ADF | 25.19 |
| 钙 Ca | 0.62 |
| 磷 P | 0.33 |
1)预混料为每千克饲粮提供 The premix provided the following per kg of the diet:VA 3 000 IU,VD 1 250 IU,VE 40 IU,Cu 6.25 mg,Fe 62.5 mg,Zn 62.5 mg,Mn 50 mg,I 0.25 mg,Se 0.125 mg,Co 0.125 mg。 | |
2)消化能为计算值,其余为实测值。DE was a calculated value, while the others were measured values. |
1.4 瘤胃液样本采集及前处理
1.4.1 瘤胃发酵参数检测样本
1.4.2 瘤胃微生物检测样本
1.4.3 瘤胃代谢组检测样本
1.5 指标检测方法与分析
1.5.1 瘤胃发酵参数
1.5.2 瘤胃微生物
1.5.3 瘤胃代谢组
1.6 数据统计分析
2 结果与分析
2.1 葡聚糖与聚谷氨酸对围产期奶山羊瘤胃发酵参数的影响
表2 产后第1天奶山羊瘤胃发酵参数Table 2 Rumen fermentation parameters of dairy goats on day 1 postpartum |
| 项目 Items | 组别 Groups | 均值标准误 SEM | P值 P-value | ||
|---|---|---|---|---|---|
| LO | HI | CON | |||
| pH | 6.33b | 7.43a | 6.90ab | 0.197 | 0.044 |
| 氨态氮 NH3-N/(mg/dL) | 2.16 | 2.26 | 3.10 | 0.194 | 0.073 |
| 微生物蛋白 MCP/(g/dL) | 0.17 | 0.14 | 0.19 | 0.012 | 0.272 |
| 乙酸 Acetic acid/(mmol/L) | 4.31 | 8.17 | 6.52 | 0.826 | 0.160 |
| 丙酸 Propionic acid/(mmol/L) | 2.73 | 3.48 | 1.82 | 0.365 | 0.183 |
| 乙丙比 Acetic acid/propionic acid | 1.77 | 2.36 | 3.65 | 0.376 | 0.092 |
| 戊酸 Valeric acid/(mmol/L) | 0.18a | 0.21a | 0.06b | 0.027 | 0.024 |
| 丁酸 Butyric acid/(mmol/L) | 1.80 | 2.15 | 0.84 | 0.249 | 0.057 |
| 总挥发性脂肪酸 TVFA/(mmol/L) | 9.02 | 14.01 | 9.23 | 1.202 | 0.159 |
| 占总挥发性脂肪酸的摩尔比 Molar ratio of TVFA/% | |||||
| 乙酸 Acetic acid | 49.28 | 58.30 | 69.47 | 3.526 | 0.127 |
| 丙酸 Propionic acid | 29.15 | 24.80 | 20.21 | 1.815 | 0.320 |
| 戊酸 Valeric acid | 1.97 | 1.47 | 0.79 | 0.194 | 0.074 |
| 丁酸 Butyric acid | 19.61 | 15.42 | 9.52 | 1.675 | 0.703 |
同列数据肩标无字母或相同小写字母表示差异不显著(P>0.05),不同小写字母表示差异显著(P<0.05),不同大写字母表示差异极显著(P<0.01)。下表同。 | |
In the same row, values with no letter or the same small letter superscripts mean no significant difference (P>0.05), while with different small letter superscripts mean significant difference (P<0.05), and with different capital letter superscripts mean extremely significant difference (P<0.01). The same as below. |
表3 产后第21天奶山羊瘤胃发酵参数Table 3 Rumen fermentation parameters of dairy goats on day 21 postpartum |
| 项目 Items | 组别 Groups | 均值标准误 SEM | P值 P-value | ||
|---|---|---|---|---|---|
| LO | HI | CON | |||
| pH | 6.90 | 6.77 | 7.13 | 0.097 | 0.337 |
| 氨态氮 NH3-N/(mg/dL) | 5.07 | 7.20 | 5.60 | 0.524 | 0.246 |
| 微生物蛋白 MCP/(g/dL) | 0.34 | 0.31 | 0.31 | 0.017 | 0.827 |
| 乙酸 Acetic acid/(mmol/L) | 6.07 | 7.03 | 6.67 | 0.279 | 0.420 |
| 丙酸 Propionic acid/(mmol/L) | 2.81 | 3.27 | 3.45 | 0.232 | 0.574 |
| 乙丙比 Acetic acid/propionic acid | 2.16 | 2.17 | 2.05 | 0.122 | 0.923 |
| 戊酸 Valeric acid/(mmol/L) | 0.22 | 0.18 | 0.18 | 0.008 | 0.130 |
| 丁酸 Butyric acid/(mmol/L) | 2.16 | 2.11 | 2.47 | 0.088 | 0.206 |
| 总挥发性脂肪酸 TVFA/(mmol/L) | 11.25 | 12.59 | 12.77 | 0.459 | 0.383 |
| 占总挥发性脂肪酸的摩尔比 Molar ratio of TVFA/% | |||||
| 乙酸 Acetic acid | 53.93 | 55.69 | 52.53 | 1.348 | 0.216 |
| 丙酸 Propionic acid | 24.94 | 26.10 | 26.55 | 1.068 | 0.071 |
| 戊酸 Valeric acid | 1.92 | 1.43 | 1.45 | 0.092 | 0.237 |
| 丁酸 Butyric acid | 19.21 | 16.77 | 19.46 | 0.668 | 0.238 |
2.2 葡聚糖与聚谷氨酸对围产期奶山羊瘤胃微生物区系的影响
2.2.1 瘤胃微生物α多样性分析
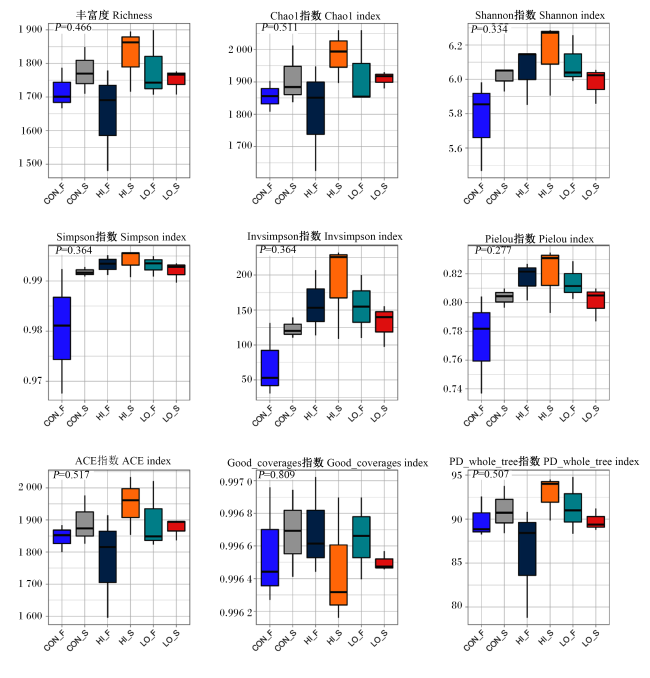
图1 瘤胃微生物α多样性分析CON_F、HI_F和LO_F分别表示产后第1天的CON组、HI组和LO组样本,CON_S、HI_S和LO_S分别表示产后第21天的CON组、HI组和LO组样本。下图同。 Fig.1 α diversity analysis of rumen microbiota CON_F, HI_F and LO_F represented the samples from CON group, HI group and LO group on day 1 postpartum, respectively; CON_S, HI_S and LO_S represented the samples from CON group, HI group and LO group on day 21 postpartum, respectively. The same as below. |
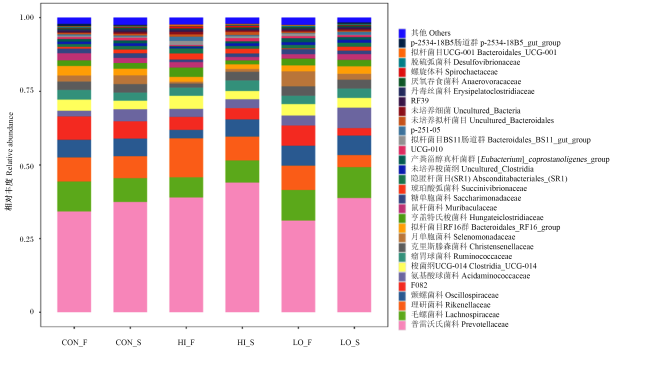
2.2.2 瘤胃微生物物种组成分析
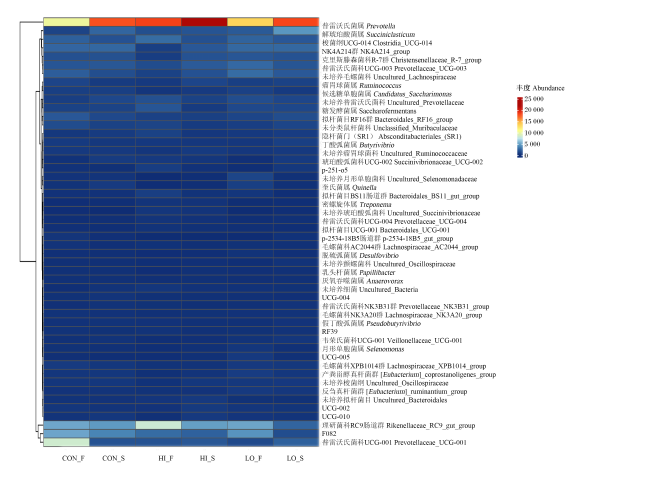
2.2.3 瘤胃微生物注释聚类分析
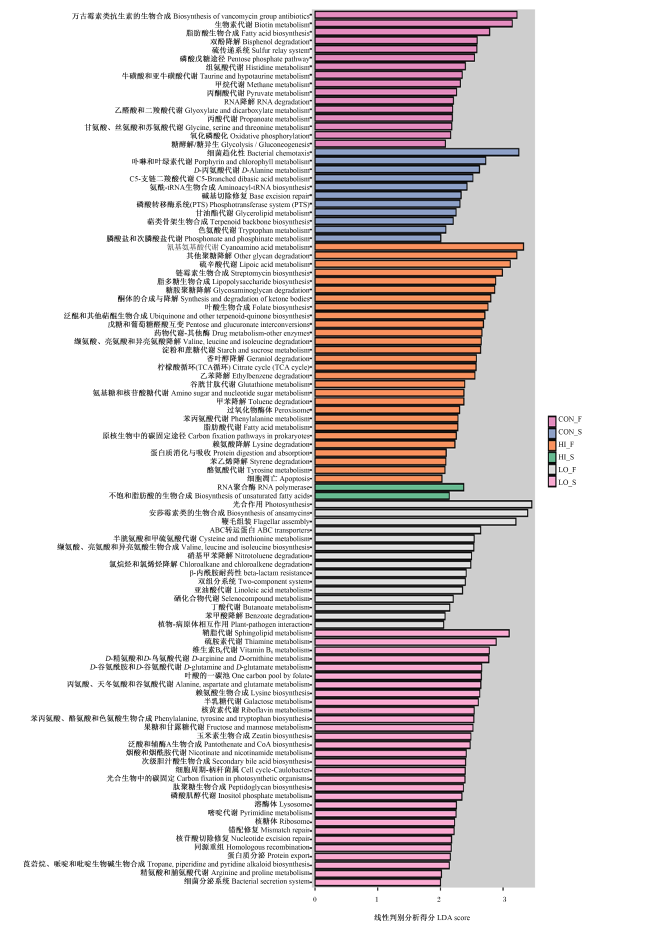
2.2.4 组间显著差异微生物功能预测
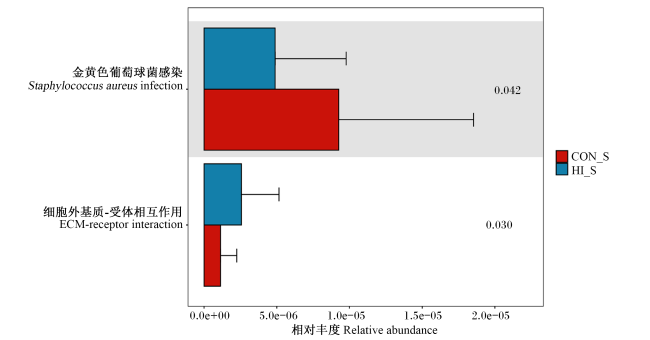
2.2.5 产后第21天HI组与CON组间显著差异微生物功能分析
2.3 葡聚糖与聚谷氨酸对围产期奶山羊瘤胃代谢组的影响
2.3.1 产后第21天HI组与CON组间瘤胃液差异代谢物筛选
表4 产后第21天HI组与CON组间瘤胃液差异代谢物数据统计表Table 4 Statistical table of differential metabolites in rumen fluid between HI group and CON group on day 21 postpartum |
| 项目 Item | 差异代谢物 Differential metabolites | 下调差异代谢物 Down-regulated differential metabolites | 上调差异代谢物 Up-regulated differential metabolites |
|---|---|---|---|
| HI组vs. CON组 HI group vs. CON group | 171 | 73 | 98 |
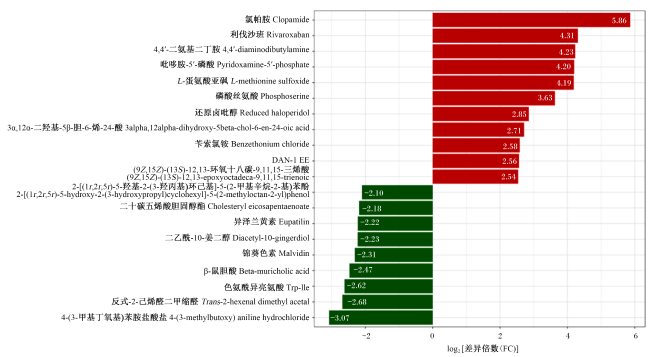
图6 产后第21天HI组与CON组间|log2(FC)|排名前20的瘤胃液差异代谢物红色代表HI组相较于CON组显著上调的差异代谢物,绿色代表HI组相较于CON组显著下调的差异代谢物。 Fig.6 Top 20 differential metabolites in rumen fluid ranked by |log2(FC)| between HI group and CON group on day 21 postpartum Red represented the significantly up-regulated differential metabolites in the HI group compared with the CON group, while green represented the significantly down-regulated differential metabolites in the HI group compared with the CON group. |
2.3.2 产后第21天HI组与CON间瘤胃液差异代谢通路分类
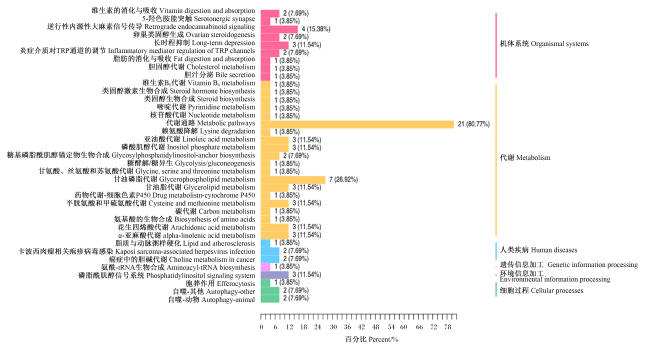
图7 产后第21天HI组与CON组间瘤胃液差异代谢物的KEGG通路分类通路右侧数值依次为注释到的差异代谢物个数及其占被注释到的差异代谢物总数的百分比。 Fig.7 KEGG pathway classification of differential metabolites in rumen fluid between the HI group and CON group on day 21 postpartum Values to the right of each pathway represented the number of annotated differential metabolites and their percentage of total number of annotated differential metabolites, respectively. |
2.3.3 产后第21天HI组与CON间瘤胃液差异代谢物富集分析及通路变化情况
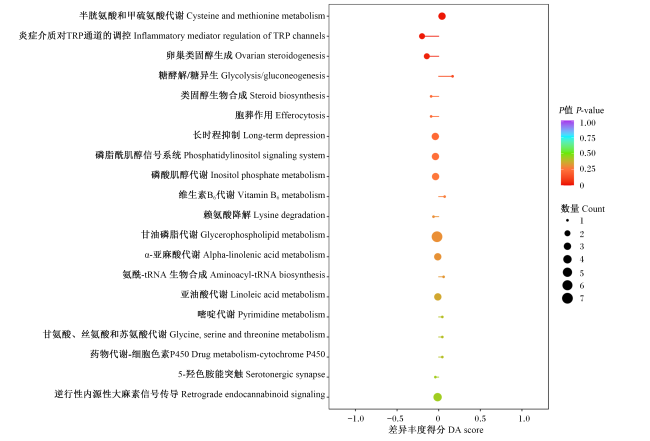


图8 产后第21天HI组与CON组间瘤胃液差异代谢通路整体变化分析纵坐标为差异代谢通路名称(按照P值排序),横坐标为差异丰度得分(DA score)。DA score反映代谢途径中所有代谢物的整体变化趋势,得分为1表示该通路中所有鉴定到的代谢物呈上调趋势,得分为-1表示该通路中所有鉴定到的代谢物呈下调趋势。线段的长度表示DA score的绝对值,线段端点的圆点大小表示该通路中差异代谢物的个数,圆点分布在中轴左侧且线段越长,表示该通路整体变化趋势越倾向于下调,圆点分布在中轴右侧且线段越长,表示该通路整体变化趋势越倾向于上调,圆点越大表示代谢物数量越多。线段和圆点颜色反映P值大小,越接近红色表示P值越小,越接近紫色表示P值越大。 Fig.8 Overall variation analysis of differential metabolic pathways in rumen fluid between HI group and CON group on day 21 postpartum The vertical axis displayed the names of differential pathways (sorted by P-value), while the horizontal axis displayed the differential abundance score (DA Score). The DA score reflected the overall change of all metabolites in a metabolic pathway. A score of 1 indicated that all identified metabolites in the pathway showed an up-regulation trend, while a score of -1 indicated that all identified metabolites in the pathway showed a down-regulation trend. The length of the line segment represented the absolute value of the DA score, and the size of the dot at the end of the segment represented the number of differential metabolites in the corresponding pathway. Dots distributed on the left side of the central axis with longer line segments indicated a stronger overall down-regulation trend of the pathway, whereas dots distributed on the right side of the central axis with longer line segments indicated a stronger overall up-regulation trend of the pathway. Larger dots indicated a greater number of metabolites. The colors of the line segments and dots reflected the magnitude of the P-value. Colors closer to red indicated smaller P-value, while colors closer to purple indicated larger P-value. |