1 材料与方法
1.1 试验设计和饲养管理
表1 基础饲粮组成及营养水平(风干基础)Table 1 Composition and nutrient levels of the basal diet (air-dry basis)% |
| 项目 Items | 含量 Content | |
|---|---|---|
| 原料 Ingredients | ||
| 玉米 Corn | 18.00 | |
| 麸皮 Wheat bran | 24.00 | |
| 豆粕 Soybean meal | 15.00 | |
| 花生秧 Peanut vine | 23.00 | |
| 花生壳 Peanut hull | 18.00 | |
| 豆油 Soybean oil | 0.40 | |
| 食盐 NaCl | 0.50 | |
| 预混料 Premix1) | 1.10 | |
| 合计 Total | 100.00 | |
| 营养水平 Nutrient levels2) | ||
| 消化能 DE/(MJ/kg) | 9.17 | |
| 粗蛋白质 CP | 15.49 | |
| 粗纤维 CF | 18.15 | |
| 粗灰分 Ash | 6.56 | |
| 赖氨酸 Lys | 0.79 | |
| 蛋氨酸+胱氨酸 Met+Cys | 0.56 | |
| 钙 Ca | 0.86 | |
| 总磷 TP | 0.45 | |
1)预混料为每千克饲粮提供 The premix provided the following per kg of the diet:VA 8 000 IU,VD3 960 IU,VE 41 mg,赖氨酸 Lys 2.2 g,蛋氨酸 Met 1.1 g,Cu (as copper sulfate) 10 mg,Fe (as ferrous sulfate) 80 mg,Mn (as manganese sulfate) 60 mg,Zn (as zinc sulfate) 50 mg,CaCO3 3 500 mg。 | |
2)消化能为计算值,其余为实测值。DE was a calculate value, while the others were measured values. |
1.2 样品采集及指标测定
1.2.1 饲粮营养成分
1.2.2 生长性能
腹泻率(%)=[(腹泻只数×腹泻天数)/
(样本总数×试验天数)]×100;
死亡率(%)=(死亡只数/样本总数)×100。
1.2.3 血清炎症指标
1.2.4 肠道微生物KEGG通路
1.3 数据分析和统计
2 结果与分析
2.1 茵陈黄酮对肉兔生长性能的影响
表2 茵陈黄酮对肉兔生长性能的影响Table 2 Effects of capillarisin on growth performance of meat rabbits |
| 项目 Items | 对照组 Control group | 试验Ⅰ组 Test group Ⅰ | 试验Ⅱ组 Test group Ⅱ | 试验Ⅲ组 Test group Ⅲ |
|---|---|---|---|---|
| 初始体重 IBW/g | 1 347.48±72.39 | 1 345±45.79 | 1 341.83±48.43 | 1 343.30±53.92 |
| 末期体重 FBW/g | 2 536.00±142.00 | 2 562.43±122.55 | 2 583.13±98.89 | 2 540.93±153.22 |
| 平均日采食量 ADFI/g | 139.70±9.77 | 138.33±6.99 | 139.00±7.56 | 139.29±9.00 |
| 平均日增重 ADG/g | 42.45±3.41 | 43.48±4.01 | 44.33±3.07 | 42.77±4.75 |
| 料重比 F/G | 3.30±0.17a | 3.20±0.19ab | 3.14±0.17b | 3.28±0.26a |
| 腹泻率 Diarrhea rate/% | 5.00 | 3.33 | 0 | 0 |
| 死亡率 Mortality/% | 3.33 | 3.33 | 0 | 0 |
同行数据肩标不同小写字母表示差异显著(P<0.05),相同或无字母表示差异不显著(P>0.05)。下表同。 | |
In the same row, values with different small letter superscripts mean significant difference (P<0.05), while with the same or no letter superscripts mean no significant difference (P>0.05). The same as below. |
2.2 茵陈黄酮对肉兔血清炎症指标的影响
表3 茵陈黄酮对肉兔血清炎症指标的影响Table 3 Effects of capillarisin on serum inflammatory indices of meat rabbitspg/mL |
| 项目 Items | 对照组 Control group | 试验Ⅰ组 Test group Ⅰ | 试验Ⅱ组 Test group Ⅱ | 试验Ⅲ组 Test group Ⅲ |
|---|---|---|---|---|
| 白细胞介素-6 IL-6 | 58.14±4.51a | 34.97±4.48c | 27.16±4.86d | 40.55±4.70b |
| 肿瘤坏死因子-α TNF-α | 4 384.26±261.47a | 2 600.33±299.33c | 2 137.64±298.70d | 3 155.06±270.17b |
| 核因子-κB NF-κB | 1 821.90±100.80a | 932.41±177.38c | 643.70±154.19d | 1 153.08±138.24b |
2.3 茵陈黄酮对肉兔盲肠微生物的影响
2.3.1 各样本可行性分析
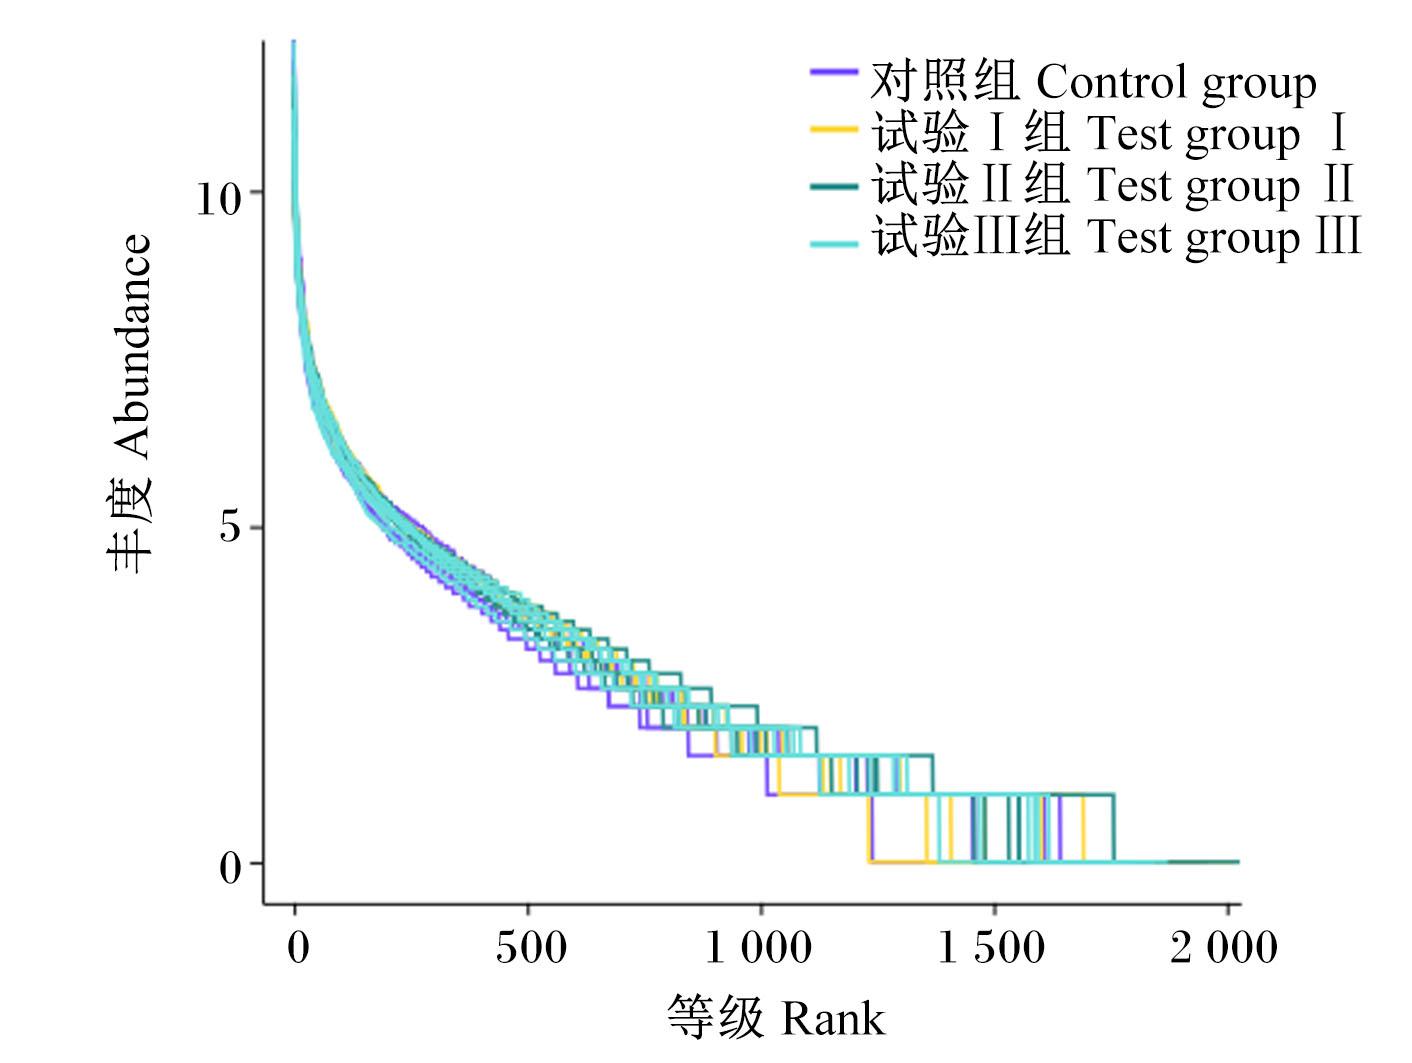
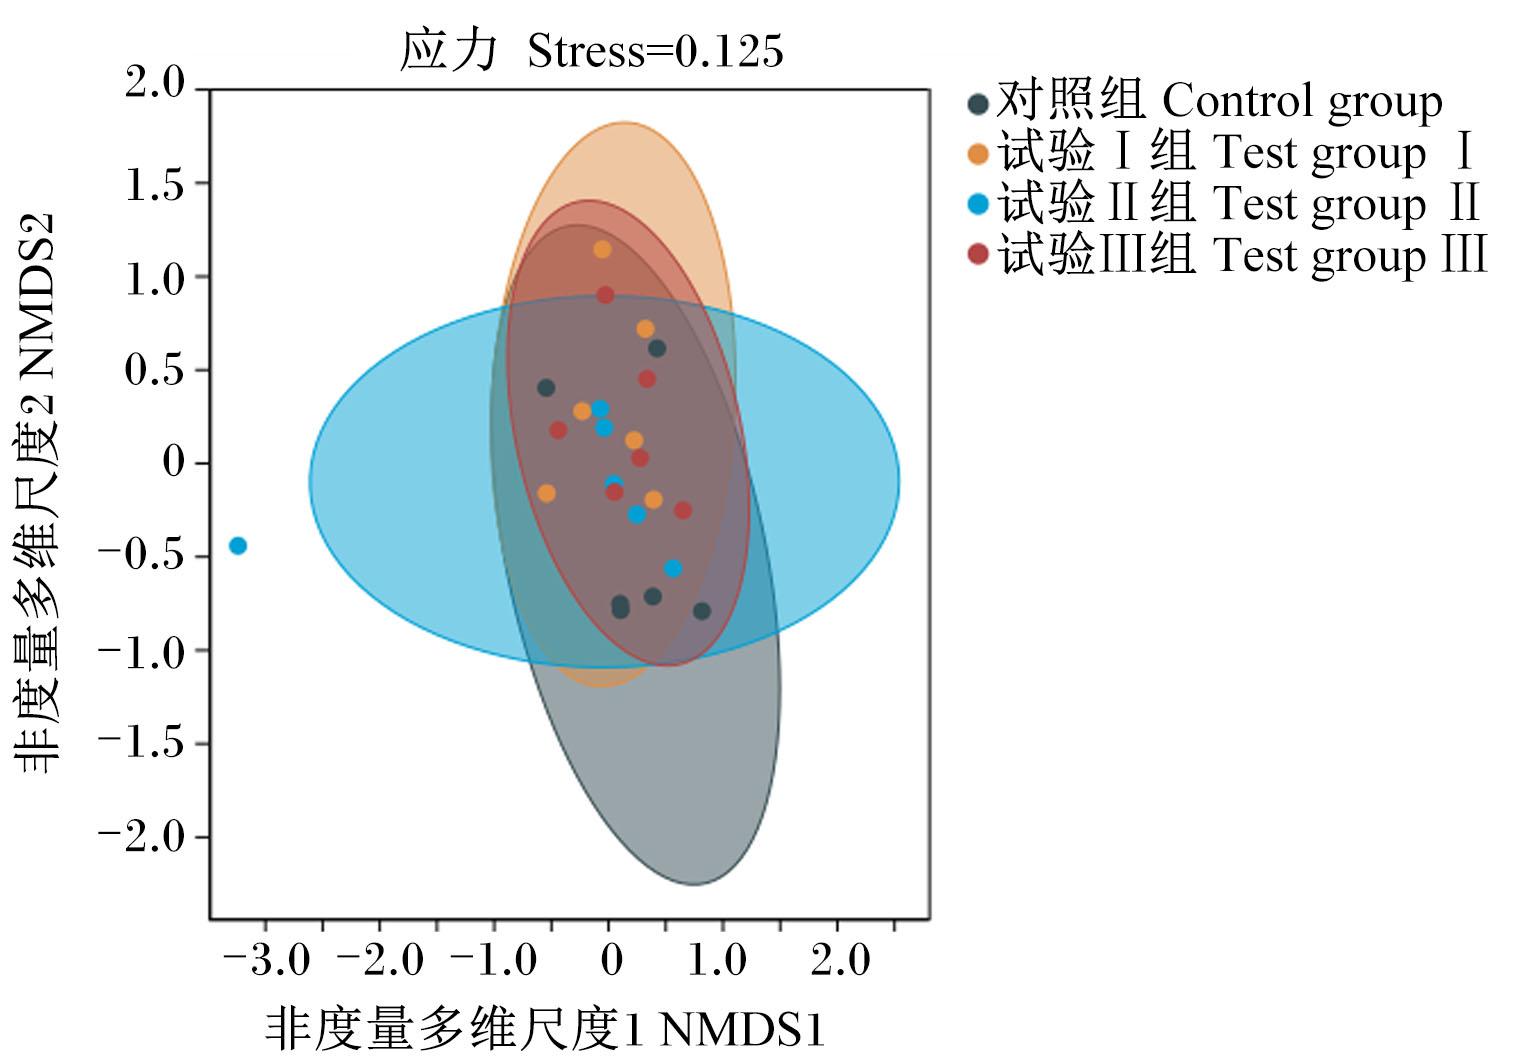
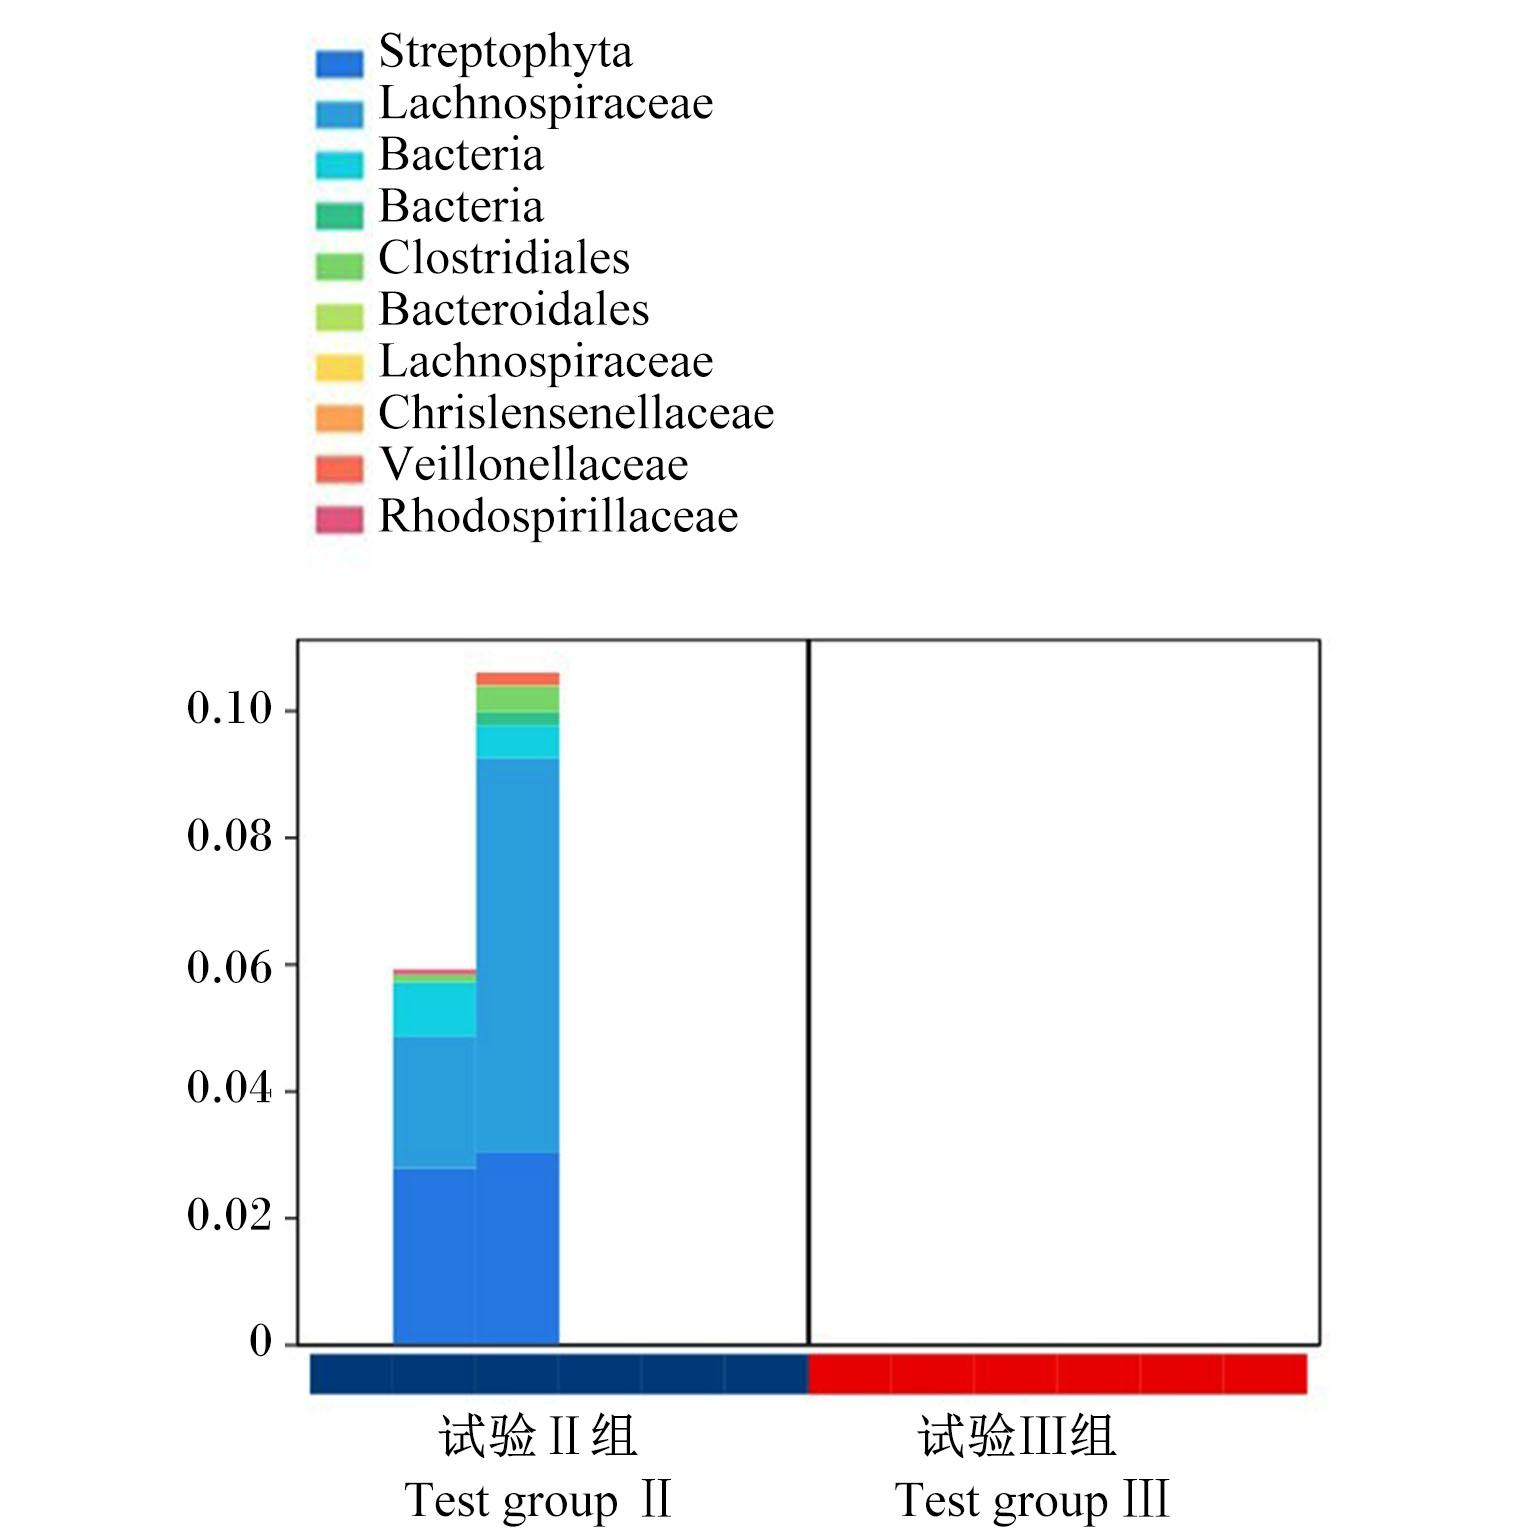
2.3.2 盲肠微生物多样性分析
表4 盲肠微生物Alpha多样性指数Table 4 Alpha diversity indices of cecal microflora |
| 项目 Items | 对照组 Control group | 试验Ⅰ组 Test group Ⅰ | 试验Ⅱ组 Test group Ⅱ | 试验Ⅲ组 Test group Ⅲ |
|---|---|---|---|---|
| Chao1指数 Chao1 index | 1 792.54±236.42 | 1 789.92±238.52 | 1 861.92±141.35 | 1 818.35±159.43 |
| Observed_species指数 Observed_species index | 1 716.67±204.64 | 1 691.30±217.09 | 1 787.05±127.69 | 1 742.93±126.87 |
| Simpson指数 Simpson index | 0.98±0.01 | 0.99±0.00 | 0.99±0.00 | 0.99±0.01 |
| Shannon指数 Shannon index | 8.19±0.41 | 8.50±0.15 | 8.48±0.17 | 8.32±0.42 |
| Pielou_e指数 Pielou_e index | 0.76±0.03 | 0.79±0.01 | 0.79±0.01 | 0.77±0.04 |
2.3.3 盲肠微生物组成在门水平上的分布
表5 盲肠微生物组成在门水平上的分布Table 5 Distribution of cecal microflora composition at phylum level% |
| 项目 Items | 对照组 Control group | 试验Ⅰ组 Test group Ⅰ | 试验Ⅱ组 Test group Ⅱ | 试验Ⅲ组 Test group Ⅲ |
|---|---|---|---|---|
| 厚壁菌门 Firmicutes | 52.97±4.64 | 51.10±3.42 | 53.88±4.51 | 50.34±12.18 |
| 拟杆菌门 Bacteroidetes | 25.50±5.21 | 24.75±4.91 | 21.78±3.25 | 20.49±6.19 |
| 变形菌门 Proteobacteria | 1.95±0.75 | 2.83±1.11 | 2.39±0.73 | 2.35±0.86 |
| 软壁菌门 Tenericutes | 2.65±3.80 | 0.95±0.43 | 0.75±0.37 | 3.08±3.22 |
| 疣微菌门 Verrucomicrobia | 0.56±0.45 | 1.18±0.73 | 1.22±0.93 | 1.16±0.93 |
| 放线菌门 Actinobacteria | 1.00±0.48 | 0.66±0.10 | 0.75±0.35 | 0.77±0.17 |
| TM7 | 0.41±0.22a | 0.27±0.21ab | 0.14±0.06b | 0.19±0.20ab |
| 蓝菌门 Cyanobacteria | 0.06±0.07b | 0.07±0.07b | 0.25±0.22a | 0.10±0.09ab |
2.3.4 盲肠微生物标志物种的差异分析
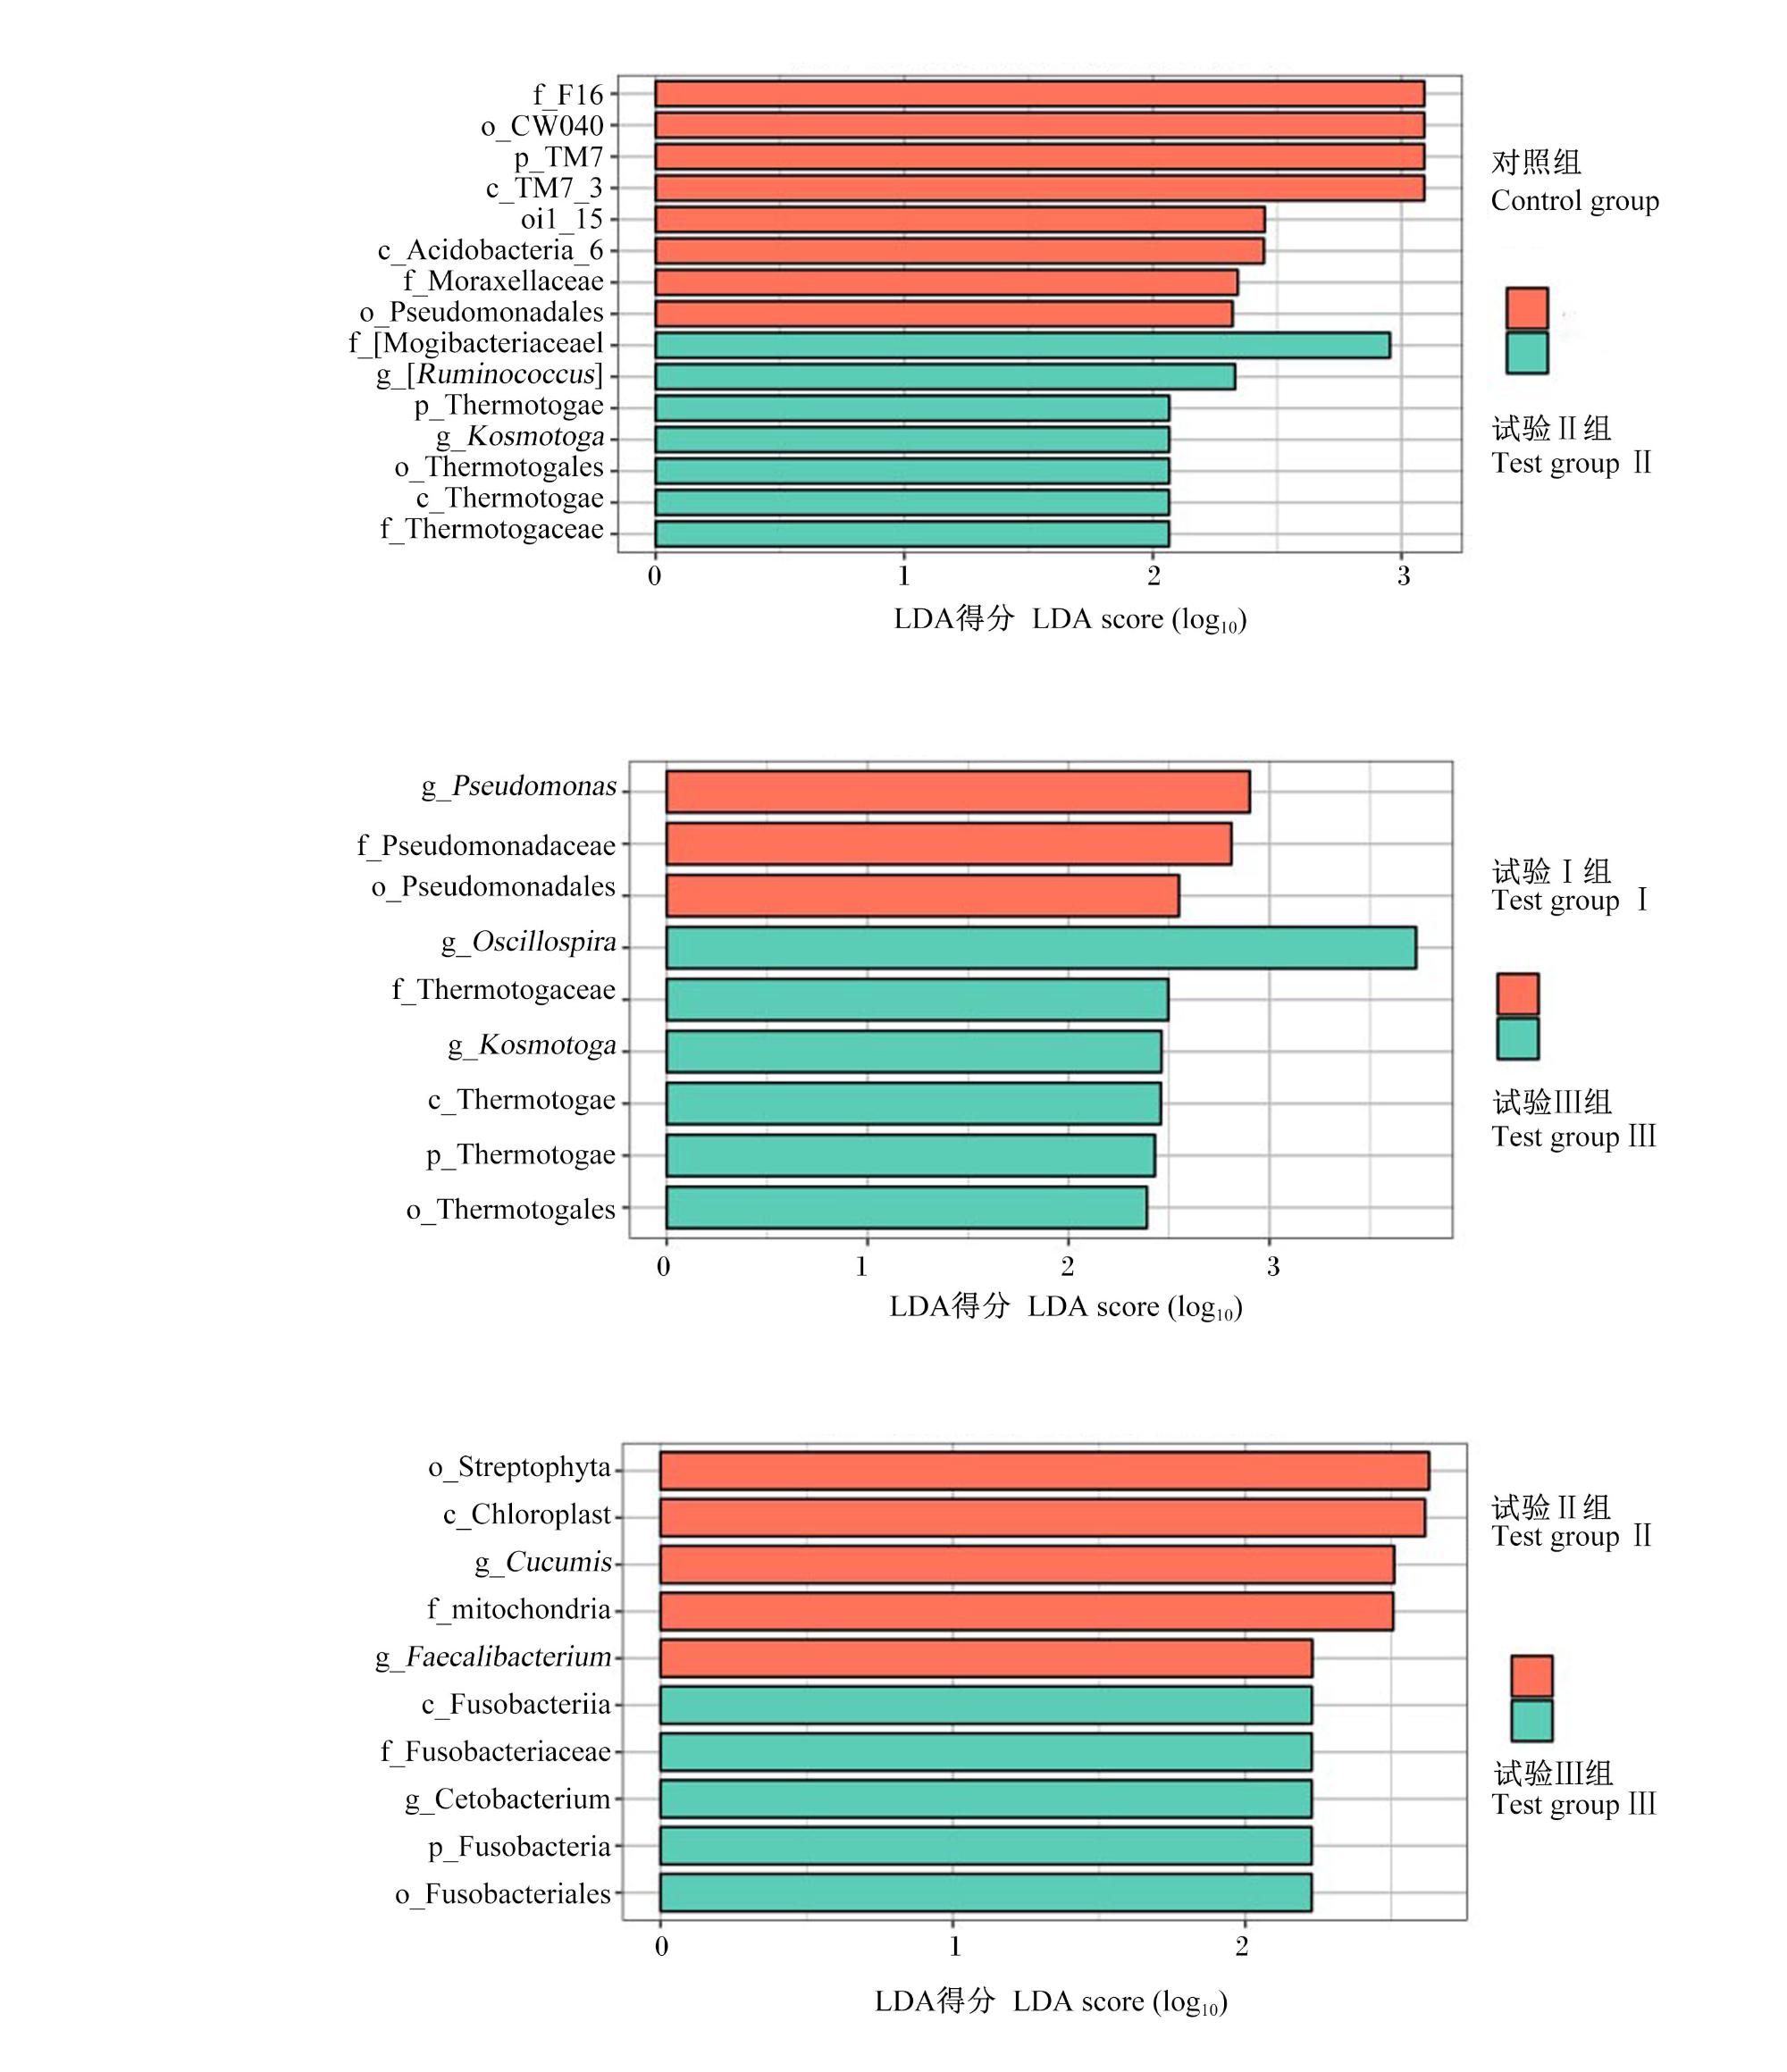
图3 盲肠微生物标志物种LEfSe分析仅列出主要标志物种 List only major marker species。Mogibacteriaceae:莫吉杆菌科;Ruminococcus:瘤胃球菌属;Thermotogae:热袍菌门;Thermotogales:热袍菌目;Thermotogaceae:热袍菌科;Kosmotoga:暖袍菌属;Oscillospira:振荡球菌属;Fusobacteriota:梭杆菌门;Fusobacteriia:梭杆菌纲;Fusobacteriales:梭杆菌目;Fusobacterium:梭杆菌属;Cetobacterium:鲸杆菌属;Gemmatimonadetes:芽单胞菌门;Chloroplast:叶绿体;Streptophyta:链形植物门;Faecalibacterium:粪杆菌属;Cucumis:黄瓜属;Mitochondria:线粒体;Cetobacterium:鲸杆菌属;Thermoactinomycetaceae:高温放线菌科;Thermoactinomyces:高温放线菌属;Faecalibacterium:粪杆菌属。 Fig.3 LEfSe analysis of cecal microflora marker species |
2.3.5 盲肠微生物KEGG通路的差异分析
表6 盲肠微生物KEGG通路的差异分析Table 6 Differential analysis of cecal microflora KEGG pathways |
| 项目 Item | 通路 Pathway | log差异倍数 logFC | 标准误SE | P值 P-value |
|---|---|---|---|---|
| 对照组vs.试验Ⅱ组 Control group vs. Test group Ⅱ | SUCSYN-PWY PWY-7347 | 0.715 0.310 | 0.228 0.103 | 0.002 0.002 |
SUCSYN-PWY:蔗糖生物合成Ⅰ sucrose biosynthesis Ⅰ;PWY-7347:蔗糖生物合成Ⅲ sucrose biosynthesis Ⅲ。 |
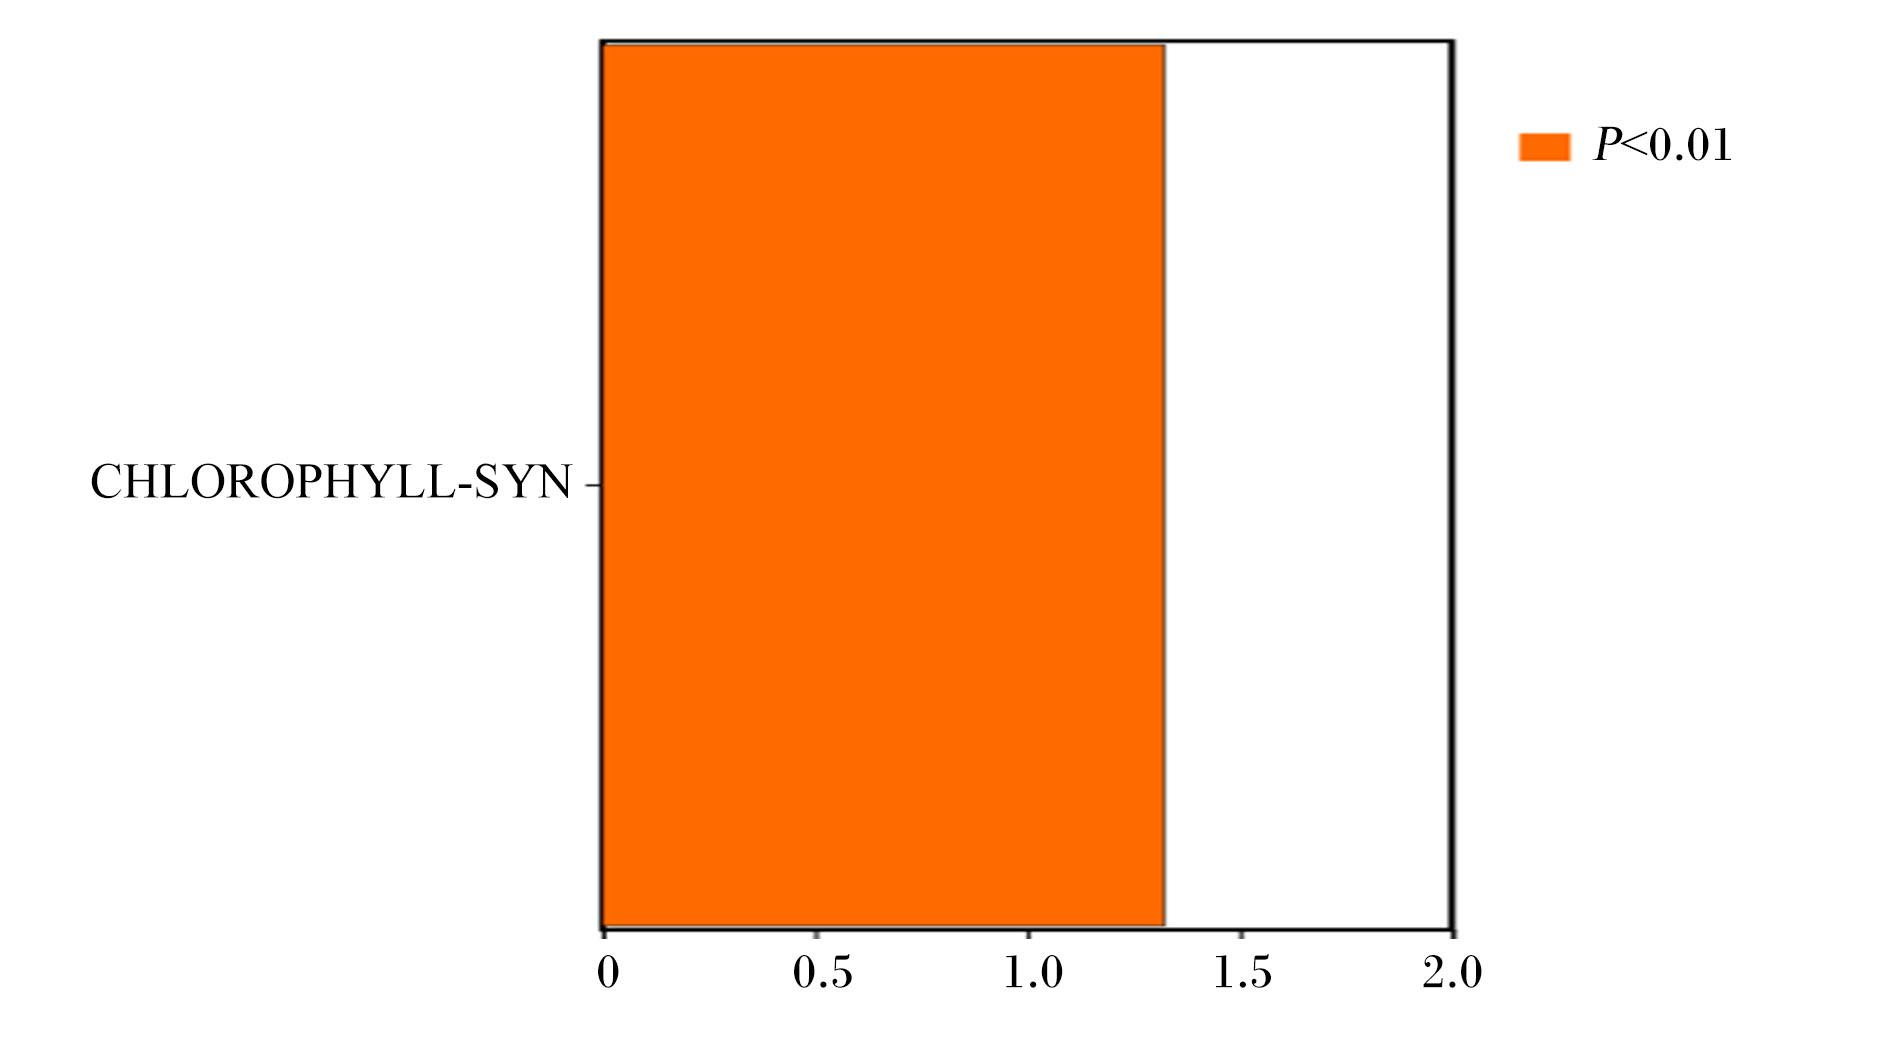
图4 盲肠微生物KEGG通路差异(试验Ⅱ组vs.试验Ⅲ组)CHLOROPHYLL-SYN:叶绿素苷A生物合成Ⅰ chlorophyll glycoside A biosynthesis Ⅰ。 Fig.4 KEGG pathways differences of cecal microflora (test group Ⅱ vs. test group Ⅲ) |