

1 材料与方法
1.1 试验材料
1.1.1 菌株来源
1.1.2 主要试剂及供试小鼠
1.2 试验方法
1.2.1 FTG包被系统的构建
1.2.2 FTG包被层对PB3生长活性的影响
1.2.3 FTG包被层对PB3抑菌活性的影响
1.3 PB3与FTG-PB3的益生性能评估
1.3.1 耐温试验
1.3.2 耐酸和耐胆盐试验
1.4 小鼠试验
1.4.1 生长性能测定
1.4.2 血清免疫因子含量测定
1.4.3 肠道组织形态观察
1.4.4 肠道菌群分析
1.5 数据分析
2 结果与分析
2.1 适用PB3的FTG包被系统的构建
表1 单宁酸溶液浓度对FT-PB3粒径的影响Table 1 Effects of TA solution concentration on FT-PB3 particle sizenm |
| 单宁酸溶液浓度 TA solution concentration/(mg/mL) | 粒径 Particle size |
|---|---|
| 0 | 393.67±9.71c |
| 10 | 230.67±5.13e |
| 20 | 339.33±10.60d |
| 30 | 522.33±37.21b |
| 40 | 572.67±10.26a |
| P值 P-value | <0.001 |
表2 β-葡聚糖溶液浓度对FTG-PB3 Zeta电位的影响Table 2 Effects of Gn solution concentration on FTG-PB3 Zeta potentialmV |
| β-葡聚糖溶液浓度 Gn solution concentration/(mg/mL) | Zeta电位 Zeta potential |
|---|---|
| 0 | -6.63±0.99a |
| 0.4 | -12.70±0.35d |
| 0.8 | -11.03±0.47c |
| 1.2 | -11.07±0.42c |
| 1.4 | -9.85±0.34b |
| P值 P-value | <0.001 |
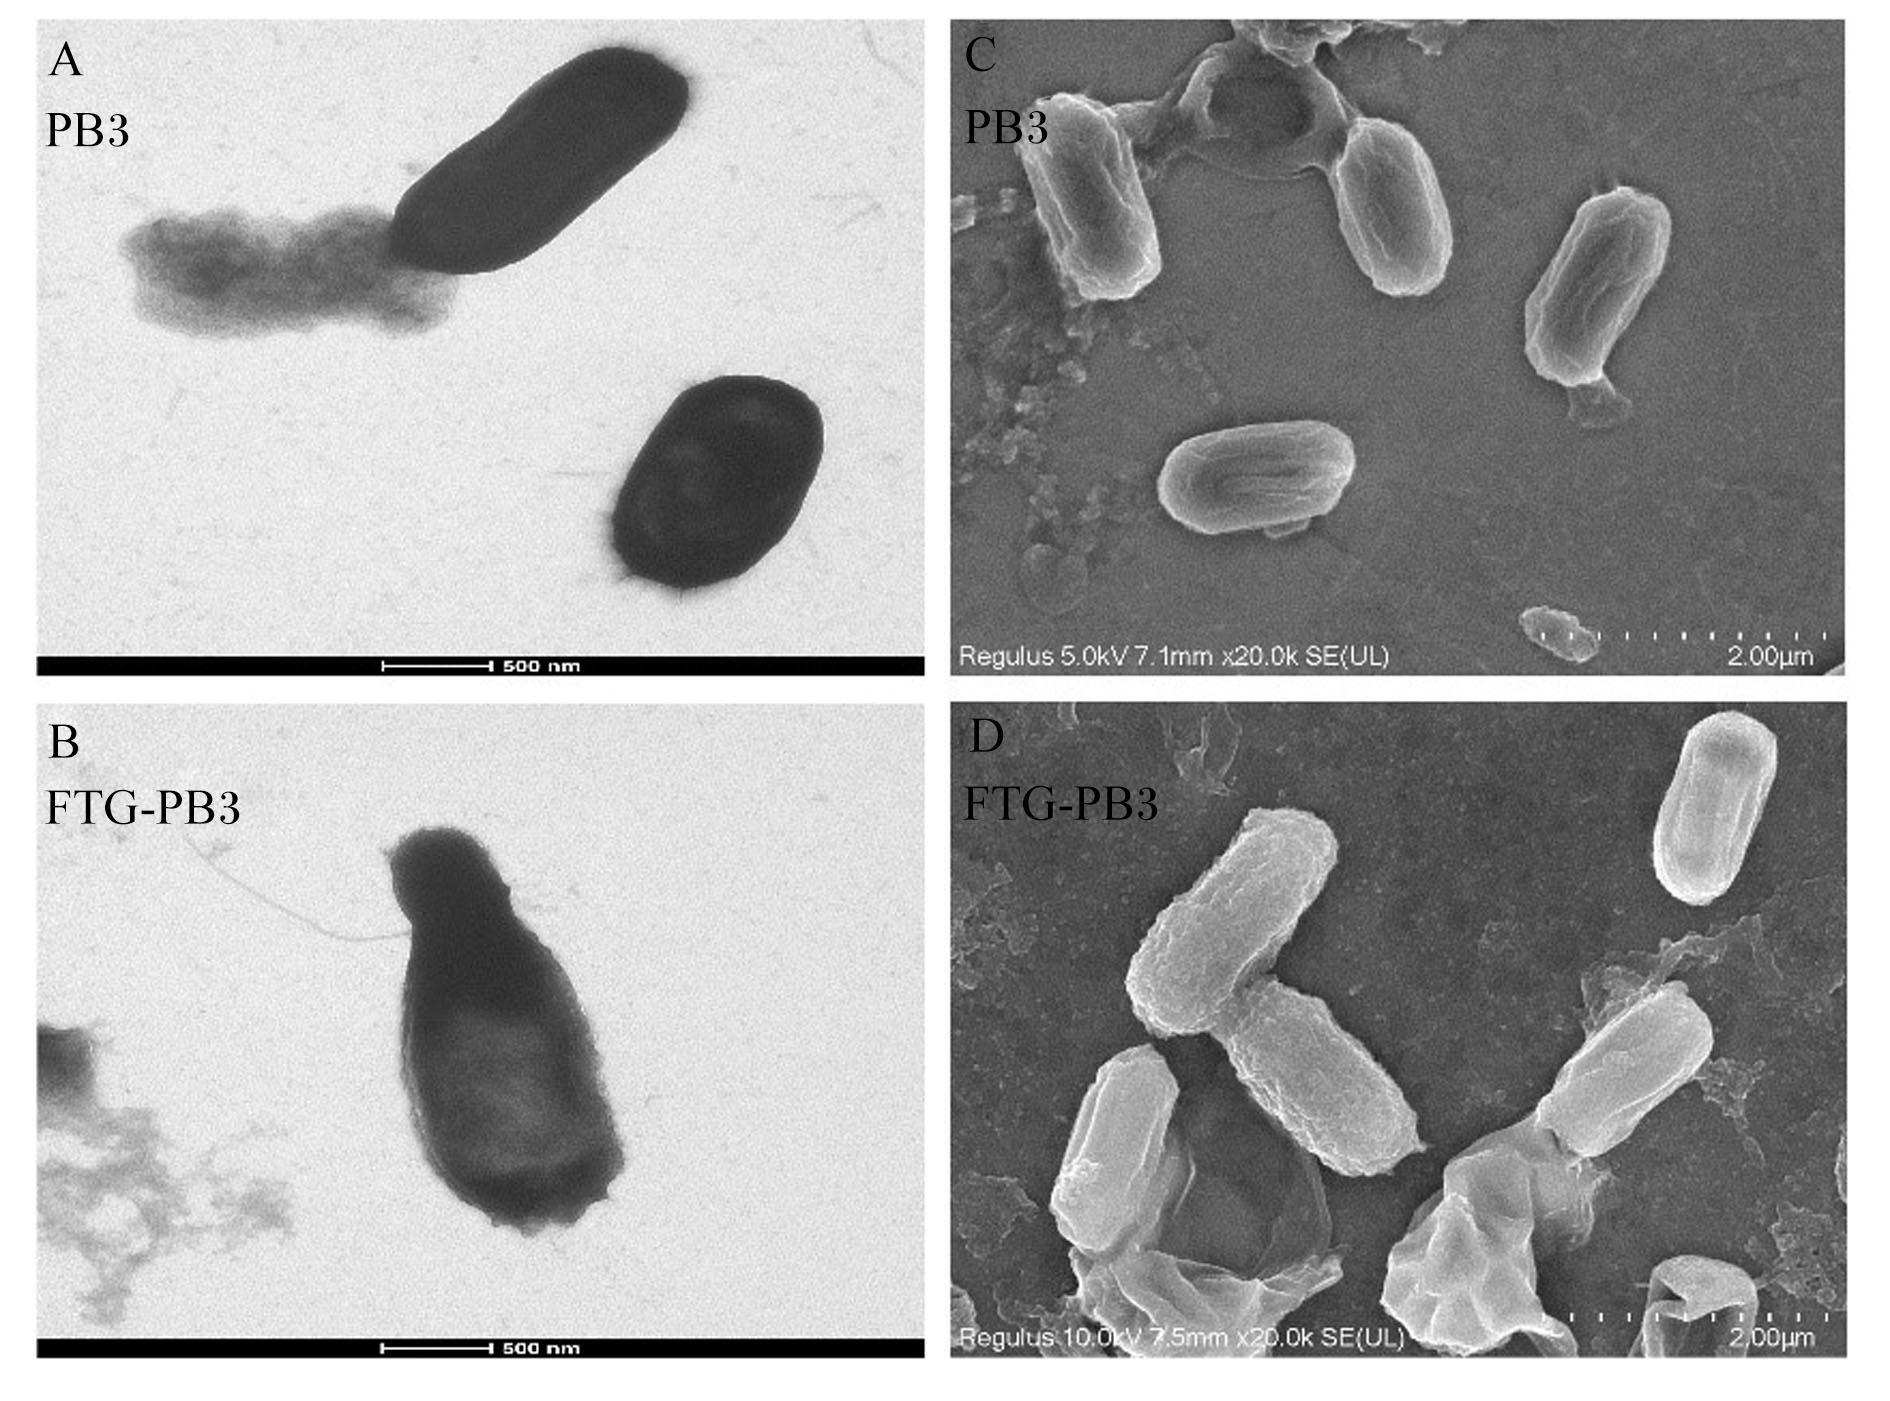
图1 PB3和FTG-PB3的透射电镜图和扫描电镜图图A和B分别为PB3和FTG-PB3的透射电镜图,图C和D分别为PB3和FTG-PB3的扫描电镜图。 Fig.1 TEM and SEM images of PB3 and FTG-PB3 Figures A and B are transmission electron microscopy (TEM) images of PB3 and FTG-PB3, respectively, and figures C and D are scanning electron microscopy (SEM) images of PB3 and FTG-PB3, respectively. |
2.2 FTG包被层对PB3生长活性的影响
表3 FTG包被层对PB3生长活性的影响(以12 h存活率表示)Table 3 Effects of FTG coating layer on growth activity of PB3 (expressed as 12 h survival rate)% |
| 项目 Items | 12 h存活率 12 h survival rate |
|---|---|
| PB3组 PB3 group | 100.00±2.32a |
| FT-PB3组 FT-PB3 group | 84.61±1.04c |
| G-PB3组 G-PB3 group | 96.39±0.83b |
| FTG-PB3组 FTG-PB3 group | 100.84±1.23a |
| P值 P-value | <0.001 |
2.3 FTG包被层对PB3抑菌活性的影响
表4 FTG包被层对PB3抑菌活性的影响(以抑菌圈直径表示)Table 4 Effects of FTG coating layer on antimicrobial activity of PB3 (expressed as inhibition zone diameter)mm |
| 项目 Items | 抑菌圈直径 Inhibition zone diameter |
|---|---|
| FTG | 6.02±0.03b |
| PB3 | 21.59±0.57a |
| FTG-PB3 | 21.86±0.56a |
| P值 P-value | <0.001 |
2.4 PB3和FTG-PB3的益生性能比较
2.4.1 耐温能力
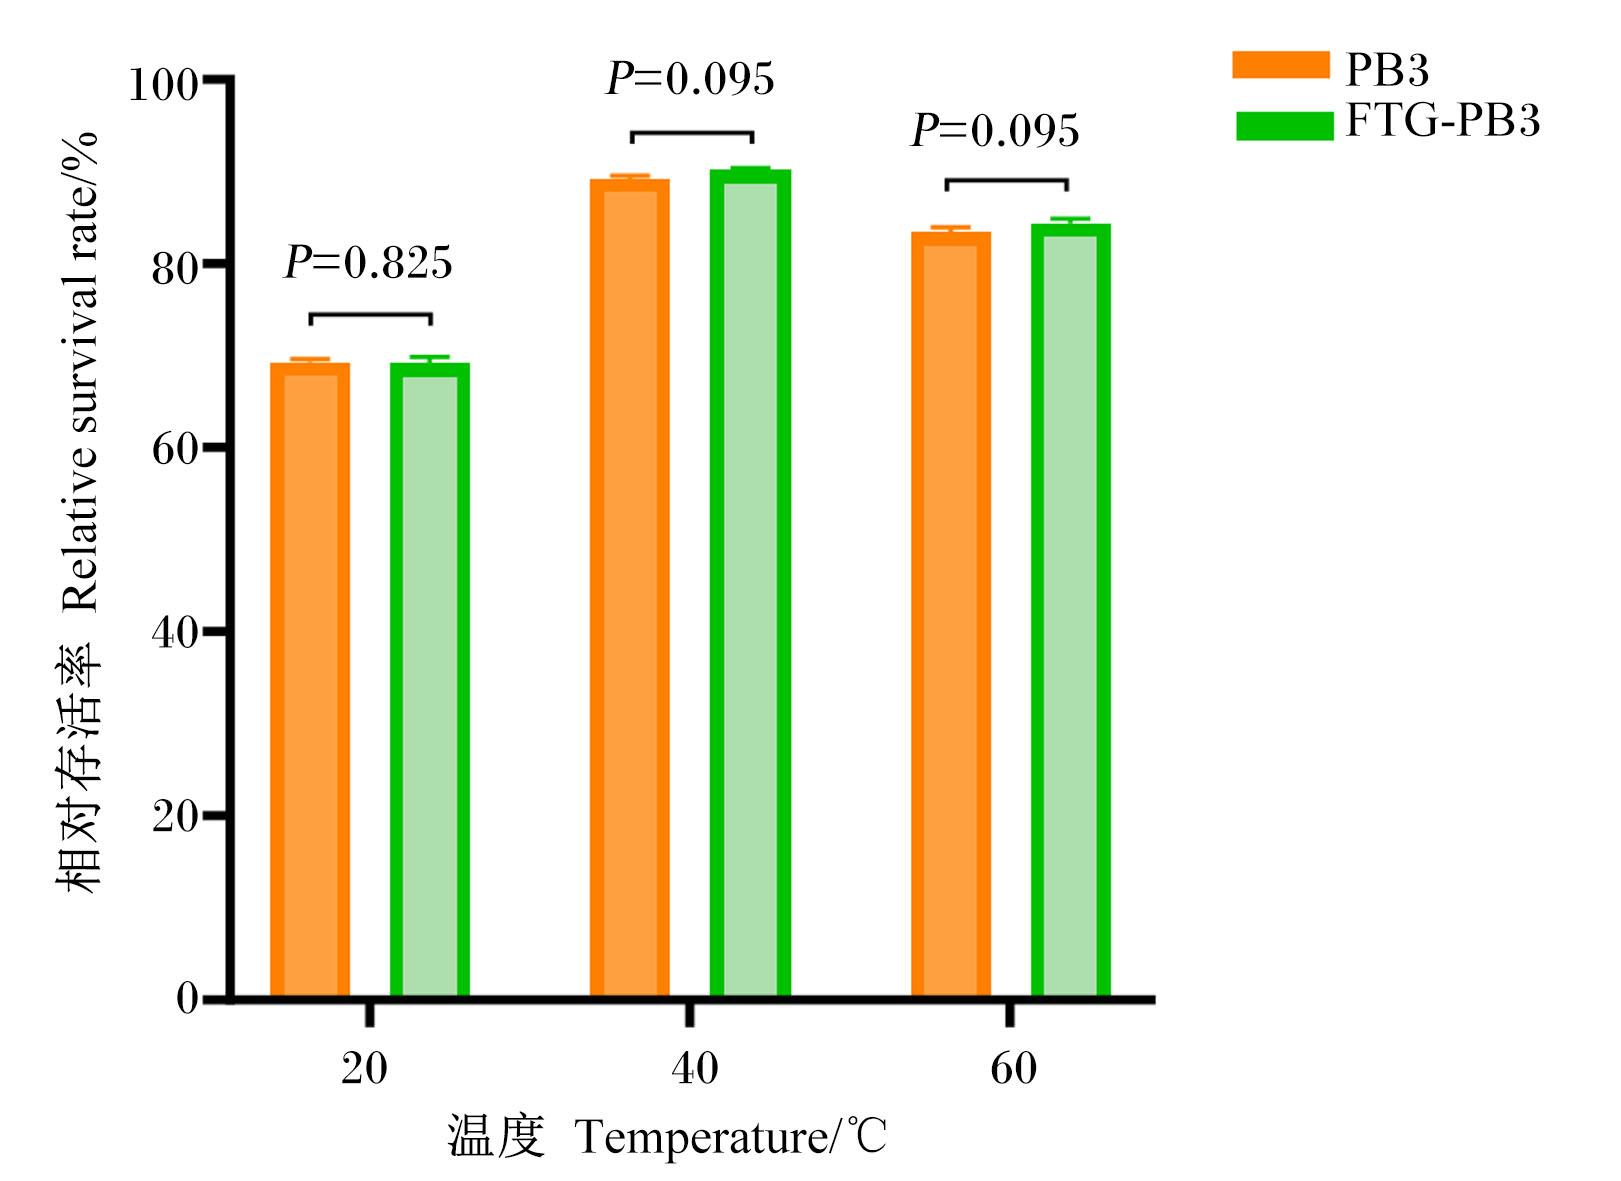
2.4.2 耐酸和耐胆盐能力
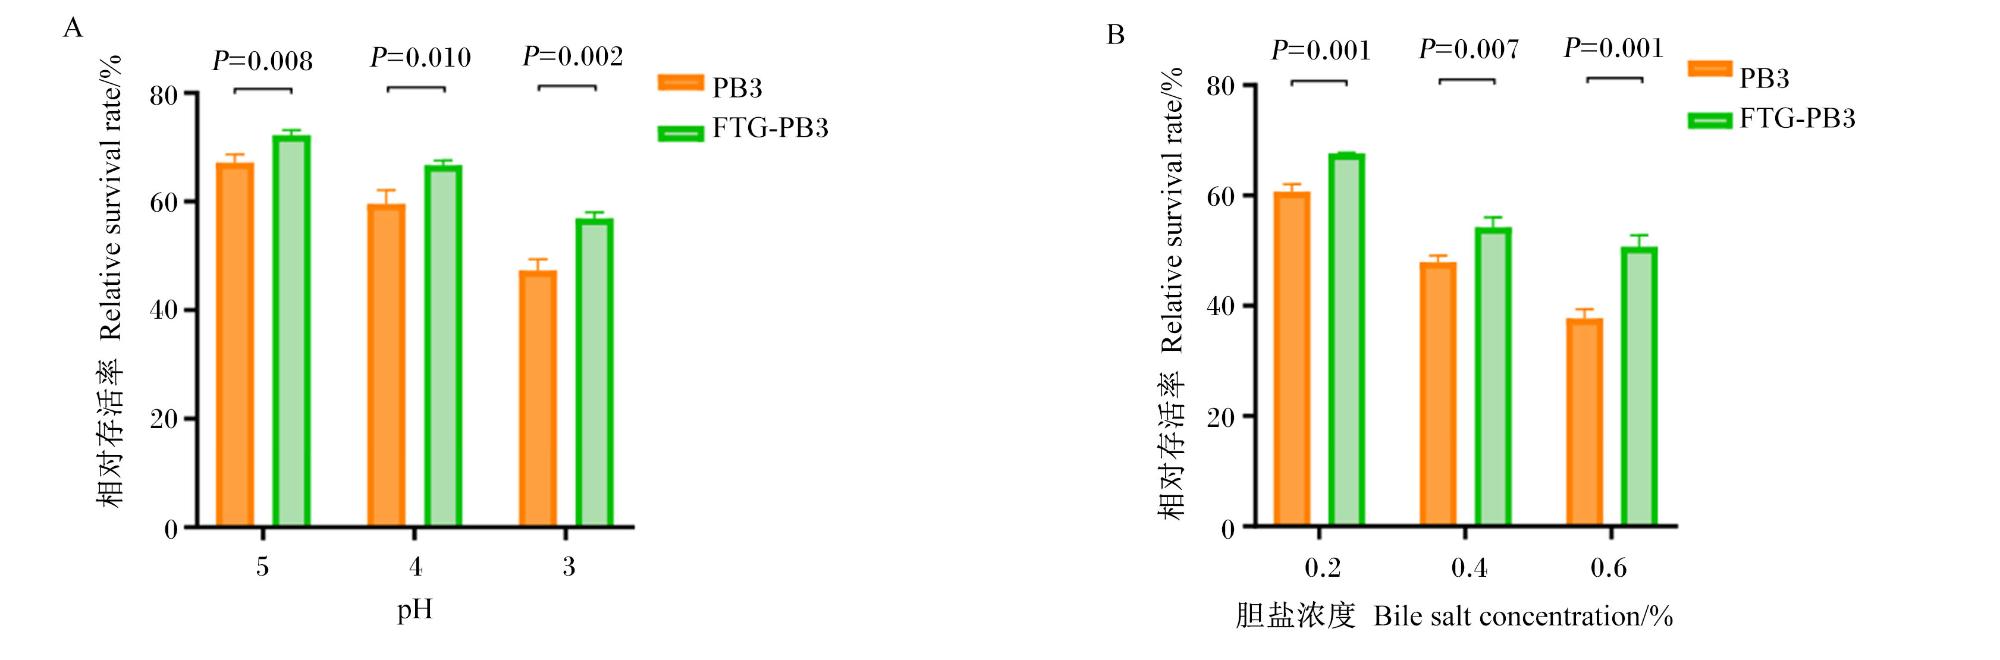
2.5 小鼠试验
2.5.1 灌胃FTG-PB3对小鼠生长性能的影响
表5 灌胃FTG-PB3对小鼠生长性能的影响Table 5 Effects of FTG-PB3 by gavage on growth performance of mice |
| 项目 Items | 对照组 CON group | FTG-PB3组 FTG-PB3 group | P值 P-value |
|---|---|---|---|
| 初始体重 IBW/g | 21.02±0.67 | 21.03±0.67 | 0.970 |
| 终末体重 FBW/g | 26.72±0.75 | 27.90±0.51 | 0.001 |
| 平均日采食量 ADFI/(g/d) | 4.97 | 5.14 | |
| 平均日增重 ADG/(g/d) | 0.20±0.01 | 0.25±0.02 | 0.001 |
| 料重比 F/G | 24.85 | 20.56 |
2.5.2 灌胃FTG-PB3对小鼠血清炎症因子含量的影响
表6 灌胃FTG-PB3对小鼠血清炎症因子含量的影响Table 6 Effects of FTG-PB3 by gavage on inflammatory factor contents in serum of miceng/L |
| 项目 Items | 对照组 CON group | FTG-PB3 组 FTG-PB3 group | P值 P-value |
|---|---|---|---|
| 促炎细胞因子 Inflammatory cytokines | |||
| 肿瘤坏死因子-α TNF-α | 982.12±228.13 | 621.52±134.24 | 0.016 |
| 白细胞介素-6 IL-6 | 33.33±6.58 | 15.59±1.93 | 0.001 |
| 抗炎细胞因子 Anti-inflammatory cytokines | |||
| 白细胞介素-10 IL-10 | 264.64±58.20 | 358.78±49.35 | 0.024 |
| 白细胞介素-22 IL-22 | 145.69±28.06 | 126.62±39.65 | 0.410 |
2.5.3 灌胃FTG-PB3对小鼠肠道形态结构的影响
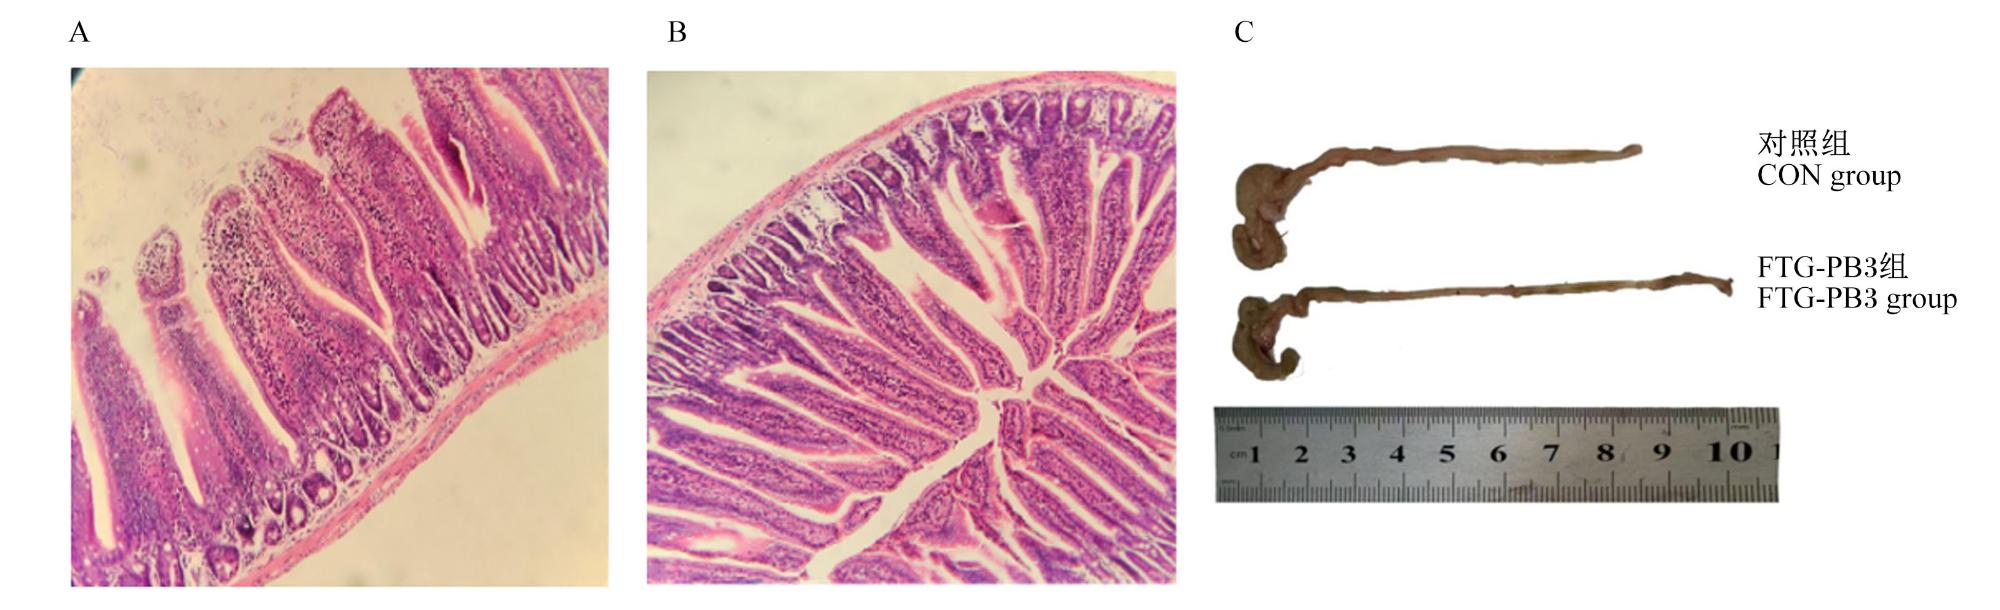
图4 小鼠回肠组织形态和结肠外观A:对照组小鼠回肠组织HE染色(50×);B:FTG-PB3组回肠组织HE染色(50×);C:对照组与FTG-PB3组小鼠结肠外观。 Fig.4 Ileal tissue morphology and colon appearance of mice A: HE staining of ileal tissue of mice in the control group (50×); B: HE staining of ileal tissue of mice in the FTG-PB3 group (50×); C: colon appearance of mice in the control group and FTG-PB3 group. |
表7 灌胃FTG-PB3对小鼠肠道形态结构的影响Table 7 Effects of FTG-PB3 by gavage on intestinal morphology and structure of mice |
| 项目 Items | 对照组 CON group | FTG-PB3组 FTG-PB3 group | P值 P-value |
|---|---|---|---|
| 回肠 Ileum | |||
| 绒毛高度 Villus height/μm | 535.02±17.18 | 565.26±20.34 | 0.019 |
| 隐窝深度 Crypt depth/μm | 79.57±4.31 | 72.73±5.14 | 0.030 |
| 绒毛高度∕隐窝深度 V/C | 6.73±0.40 | 7.81±0.68 | 0.007 |
| 结肠 Colon | |||
| 长度 Length/cm | 7.20±0.51 | 8.92±0.58 | 0.010 |
2.5.4 灌胃FTG-PB3对小鼠肠道菌群的影响
2.5.4.1 肠道菌群多样性分析
表8 灌胃FTG-PB3对小鼠肠道菌群α多样性的影响Table 8 Effects of FTG-PB3 by gavage on α diversity of intestinal microbiota of mice |
| 项目 Items | 对照组 CON group | FTG-PB3组 FTG-PB3 group | P值 P-value |
|---|---|---|---|
| Ace指数 Ace index | 402.58±60.55 | 253.04±170.15 | 0.149 |
| Chao1指数 Chao1 index | 401.33±61.75 | 252.81±171.24 | 0.154 |
| Shannon指数 Shannon index | 6.07±0.30 | 5.58±0.88 | 0.324 |
| Simpson指数 Simpson index | 0.96±0.01 | 0.96±0.02 | 0.486 |
| Coverage指数 Coverage index | 0.99±0.00 | 0.99±0.00 | 0.203 |
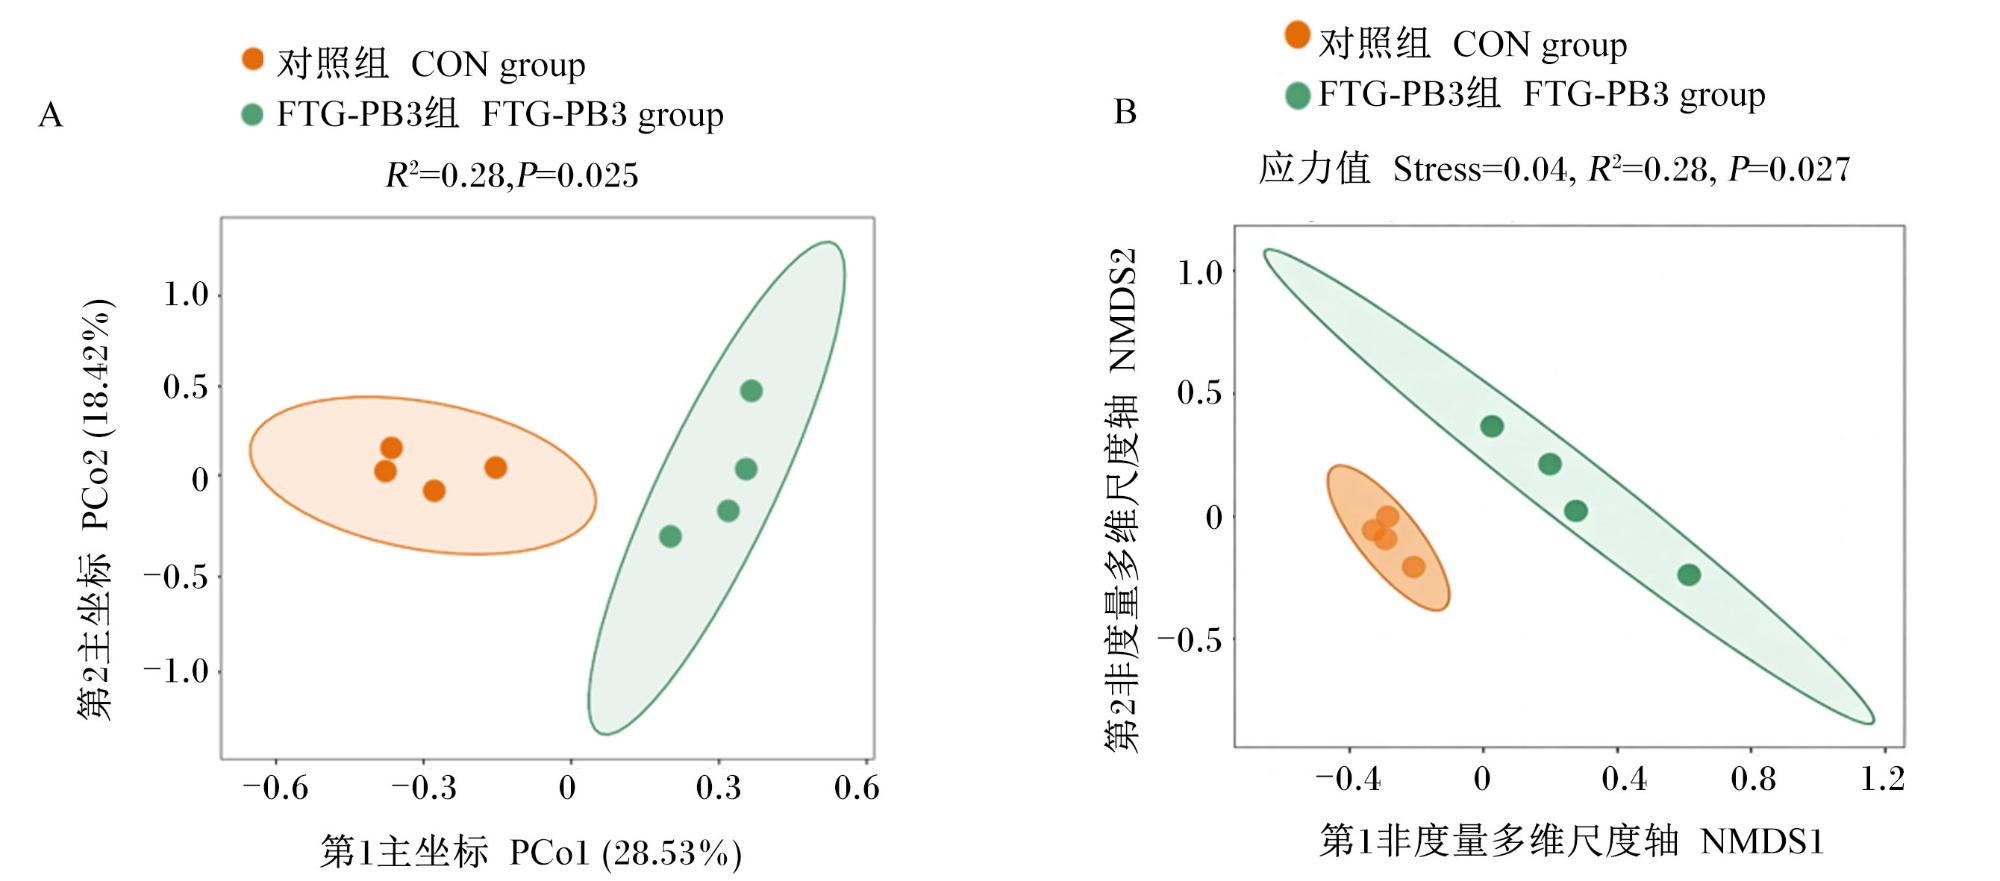
2.5.4.2 肠道菌群组成及其优势菌群分析
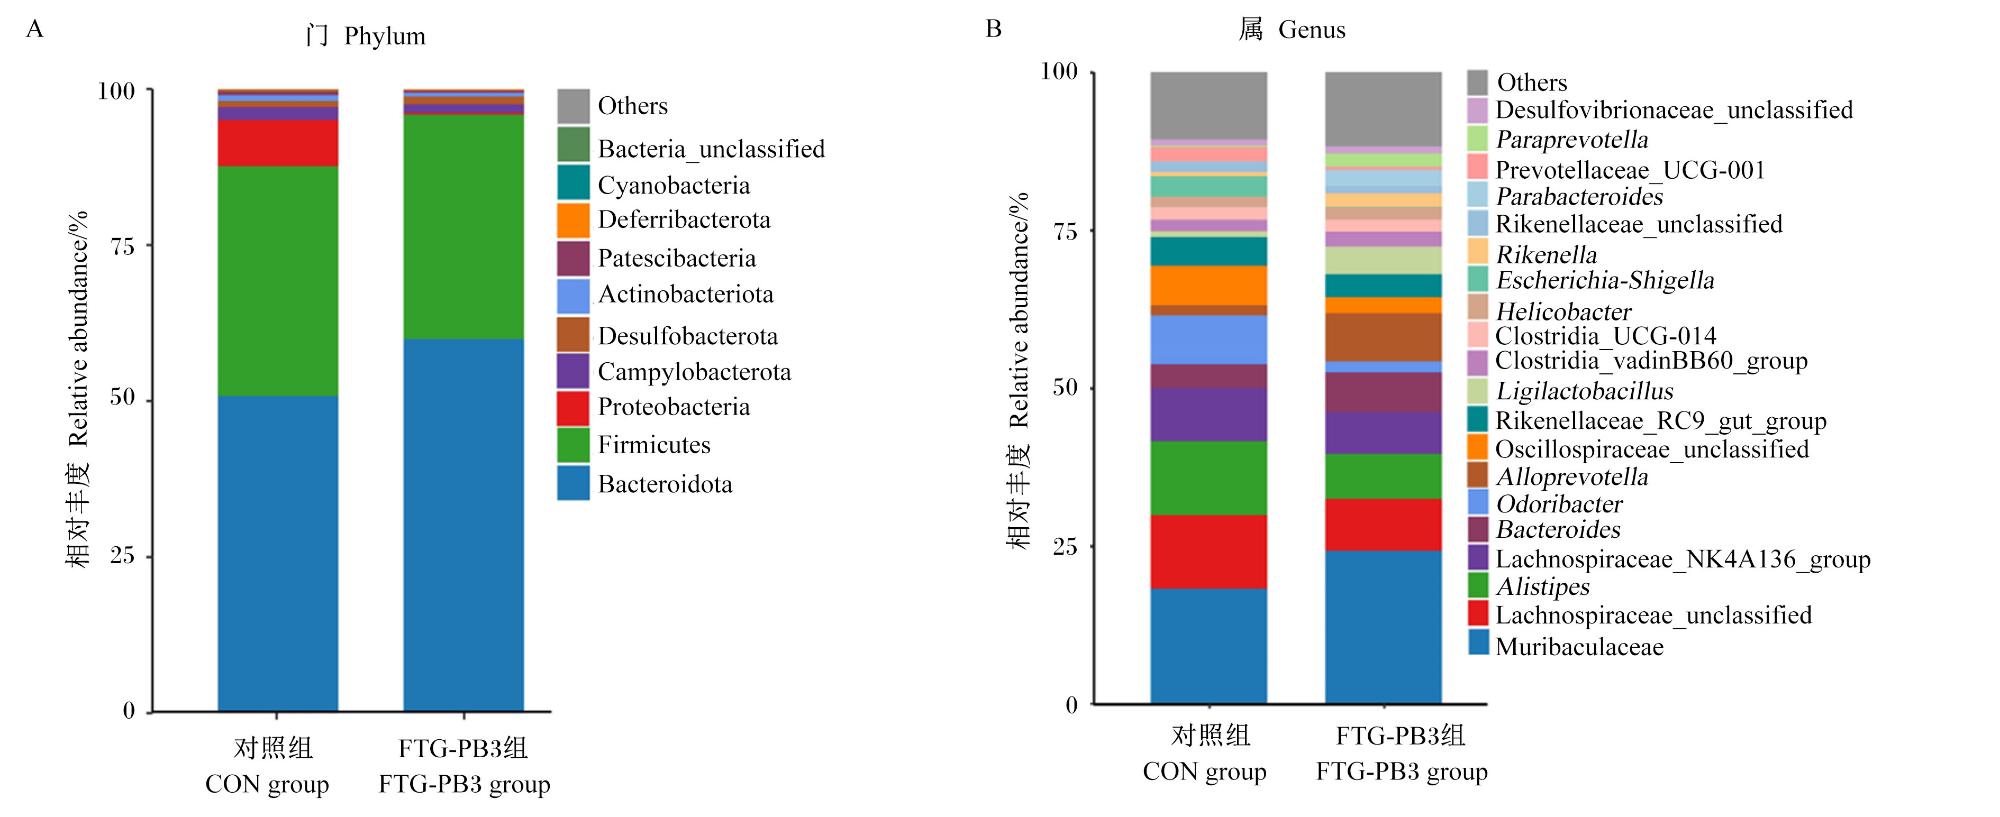
图6 灌胃FTG-PB3对小鼠肠道菌群门水平(A)和属水平(B)物种组成的影响Bacteroidota:拟杆菌门;Firmicutes:厚壁菌门;Proteobacteria:变形菌门;Campylobacterota:弯曲杆菌门;Desulfobacterota:脱硫杆菌门;Actinobacteriota:放线菌门;Patescibacteria:髌骨菌门;Deferribacterota:脱铁杆菌门;Cyanobacteria:蓝菌门;Bacteria_unclassified:未分类的细菌;Others:其他;Muribaculaceae:鼠杆菌科;Lachnospiraceae_unclassified:未分类的毛螺菌科;Alistipes:另枝菌属;Lachnospiraceae_NK4A136_group:毛螺菌科NK4A136群;Bacteroides:拟杆菌属;Odoribacter:臭气杆菌属;Alloprevotella:拟普雷沃氏菌属;Oscillospiraceae_unclassified:未分类的颤螺菌科;Rikenellaceae_RC9_gut_group:理研菌科RC9肠道群;Ligilactobacillus:联合乳杆菌属;Clostridia_vadinBB60_group:梭菌纲vadinBB60群;Clostridia_UCG-014:梭菌纲UCG-014;Helicobacter:螺杆菌属;Escherichia-Shigella:埃希氏菌-志贺氏菌属;Rikenella:理研菌属;Rikenellaceae_unclassified:未分类的理研菌科;Parabacteroides:副拟杆菌属;Prevotellaceae_UCG-001:普雷沃氏菌科UCG-001;Paraprevotella:副普雷沃氏菌属;Desulfovibrionaceae_unclassified:未分类的脱硫杆菌科。 Fig.6 Effects of FTG-PB3 by gavage on species composition at phylum level (A) and genus level (B) in intestinal microbiota of mice |
表9 灌胃FTG-PB3对小鼠肠道菌群中部分菌门和菌属相对丰度的影响Table 9 Effects of FTG-PB3 by gavage on relative abundance of selected bacterial phyla and genera in intestinal microbiota of mice% |
| 项目 Items | 对照组 CON group | FTG-PB3组 FTG-PB3 group | P值 P-value |
|---|---|---|---|
| 门水平 Phylum level | |||
| 变形菌门 Proteobacteria | 7.22±2.67 | 0.25±0.19 | 0.002 |
| 放线菌门 Actinobacteria | 0.99±0.14 | 0.61±0.14 | 0.009 |
| 弯曲杆菌门 Campylobacterota | 2.14±0.10 | 1.43±0.15 | 0.003 |
| 属水平 Genus level | |||
| 联合乳杆菌 Ligilactobacillus | 0.83±0.11 | 4.33±1.18 | 0.001 |
| 副普雷沃氏菌 Paraprevotella | 0.15±0.17 | 2.44±1.42 | 0.018 |
| 拟普雷沃氏菌 Alloprevotella | 1.56±3.13 | 7.60±3.47 | 0.042 |
| 理研菌属 Rikenella | 0.70±0.13 | 2.14±0.73 | 0.008 |
| 埃希氏菌-志贺氏菌属 Escherichia-Shigella | 10.17±1.48 | 0.01±0.01 | 0.001 |
| 另枝菌属 Alistipes | 12.26±4.81 | 3.43±0.46 | 0.011 |
2.5.4.3 差异物种分析
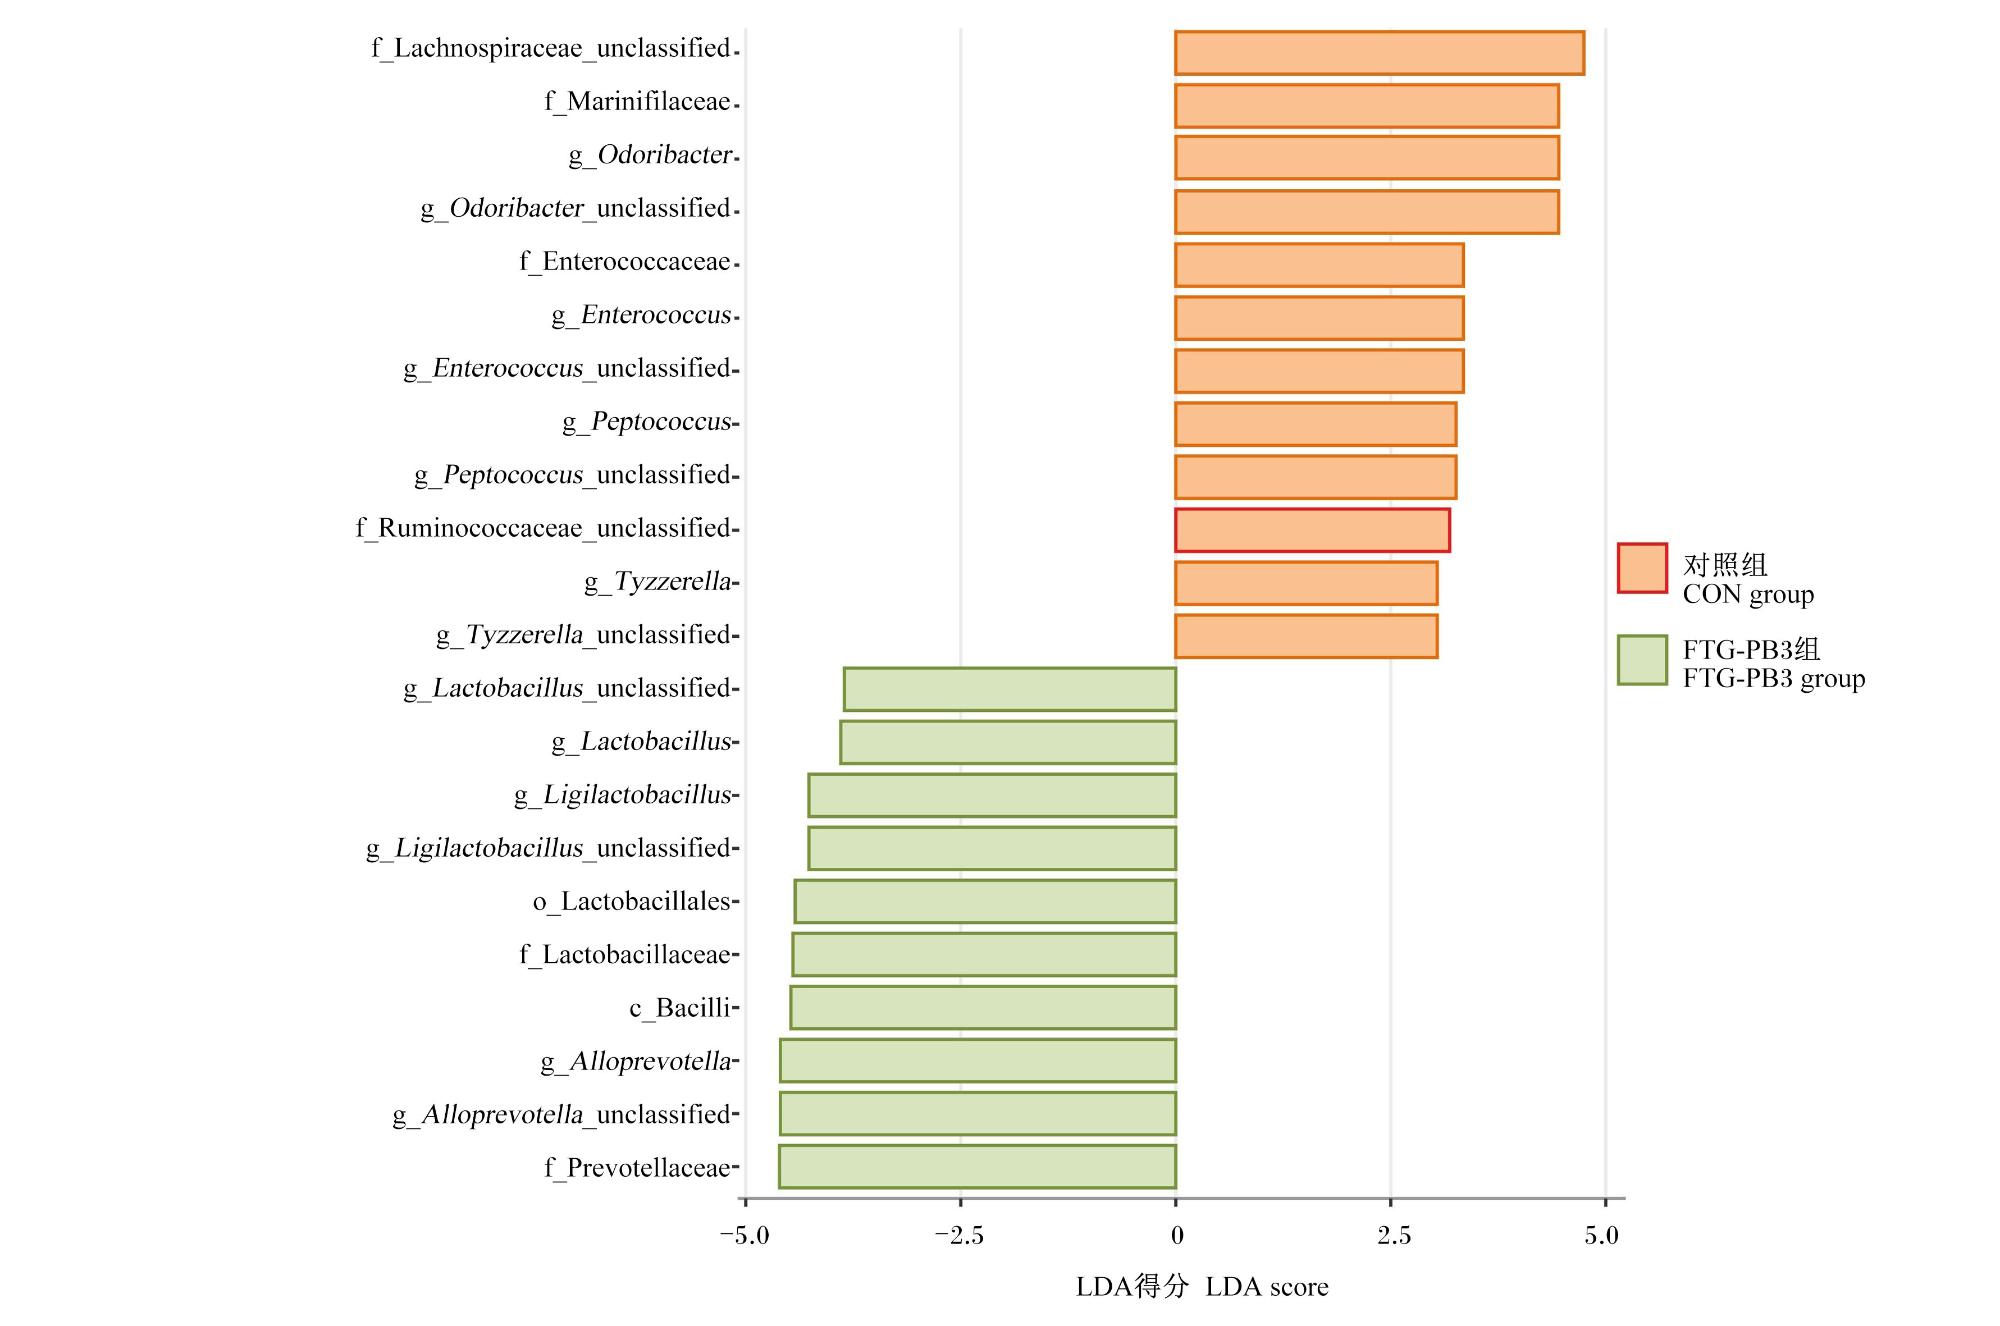
图7 基于LEfSe分析的差异菌群LDA得分图图中“f_”表示科,“g_”表示属,“o_”表示目,“c_”表示纲。In the figure, “f_” indicates family, “g_” indicates genus, “o_” indicates order, and “c_” indicates class. Lachnospiraceae_unclassified:未分类的毛螺菌科;Marinifilaceae:马尔尼菲菌科;Odoribacter:臭气杆菌属;Odoribacter_unclassified:未分类的臭气杆菌属;Enterococcaceae:肠球菌科;Enterococcus:肠球菌属;Enterococcus_unclassified:未分类的肠球菌属;Peptococcus:消化球菌属;Peptococcus_unclassified:未分类的消化球菌属;Ruminococcaceae_unclassified:未分类的瘤胃球菌科;Tyzzerella:泰泽菌属;Tyzzerella_unclassified:未分类的泰泽菌属;Lactobacillus_unclassified:未分类的乳杆菌属;Lactobacillus:乳杆菌属;Ligilactobacillus:联合乳杆菌属;Ligilactobacillus_unclassified:未分类的联合乳杆菌属;Lactobacillales:乳杆菌目;Lactobacillaceae:乳杆菌科;Bacilli:芽孢杆菌纲;Alloprevotella:拟普雷沃氏菌属;Alloprevotella_unclassified:未分类的拟普雷沃氏菌属;Prevotellaceae:普雷沃氏菌科。 Fig.7 LDA score plot of differential bacteria based on LEfSe analysis |
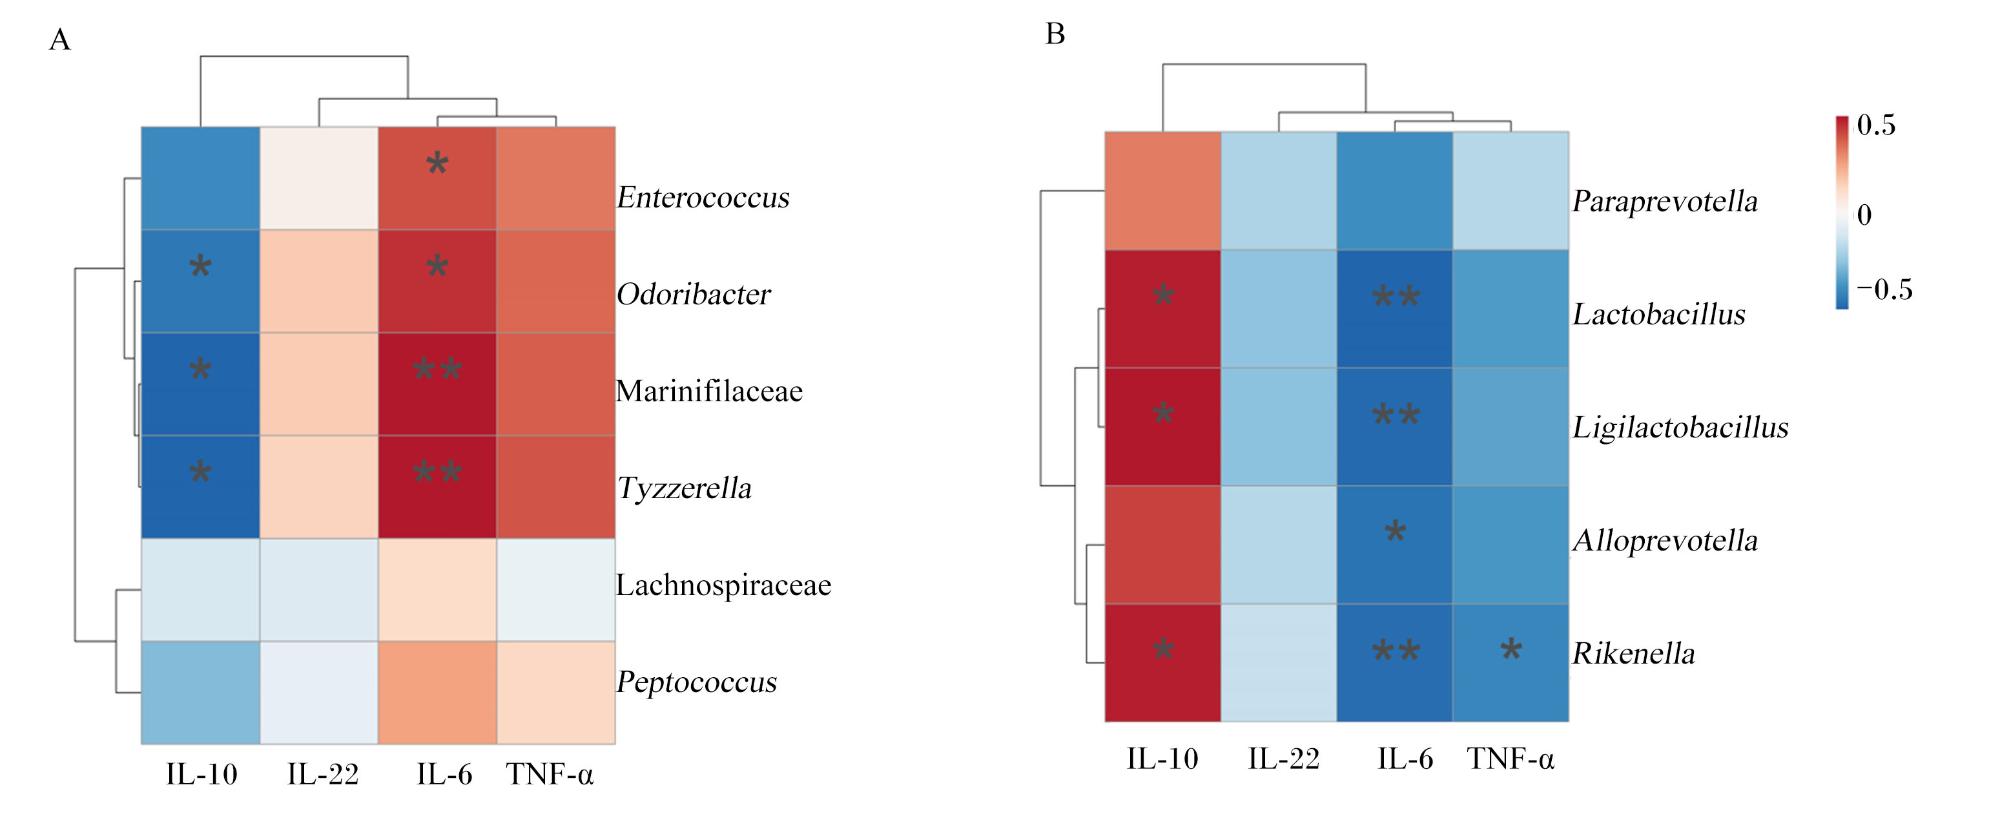


图8 对照组和FTG-PB3组富集微生物与血清炎症因子的相关性热图A:对照组富集微生物与血清炎症因子之间的Spearman相关性分析 Spearman correlation analysis between enriched microorganisms and serum inflammatory factors in the control group;B:FTG-PB3组富集微生物与血清炎症因子含量之间的Spearman相关性分析 Spearman correlation analysis between enriched microorganisms and serum inflammatory factors in the FTG-PB3 group。 IL-10:白细胞介素-10 interleukin-10;IL-22:白细胞介素-22 interleukin-22;IL-6:白细胞介素-6 interleukin-6;TNF-α:肿瘤坏死因子-α tumor necrosis factor-α;Enterococcus:肠球菌属;Odoribacter:臭气杆菌属;Marinifilaceae:马尔尼菲菌科;Tyzzerella:泰泽菌属;Lachnospiraceae:毛螺菌科;Peptococcus:消化球菌属;Paraprevotella:副普雷沃氏菌;Lactobacillus:乳杆菌属;Ligilactobacillus:联合乳杆菌属;Alloprevotella:拟普雷沃氏菌属;Rikenella:理研菌属。“*”:显著相关 significant correlation (P<0.05);“**”:极显著相关 extremely significant correlation (P<0.01)。 Fig.8 Heatmaps of correlation between enriched microorganisms and serum inflammatory factors in control group and FTG-PB3 group |