

1 材料与方法
1.1 菌株复苏及培养
1.2 动物模型的构建
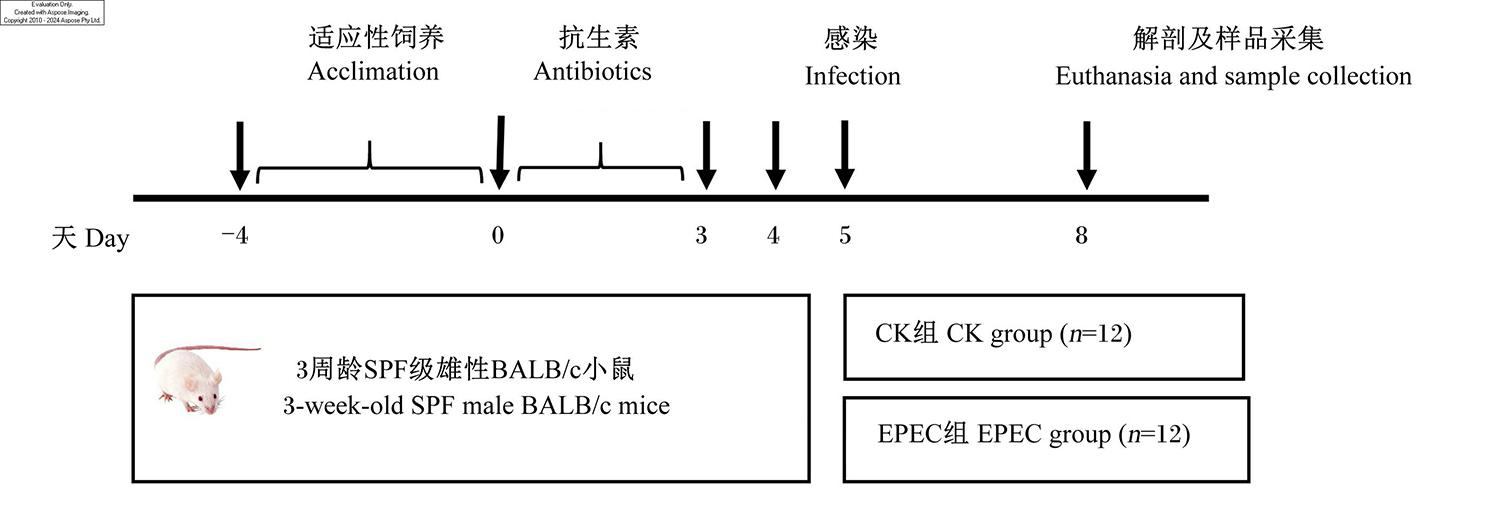
1.3 样品采集及处理
1.4 主要试剂及仪器
1.5 检测指标及方法
1.5.1 体重变化率、脾脏指数和腹泻评分
体重变化率(%)=[(末体重-初体重)/初体重]×100。
脾脏指数(%)=100×脾脏重(mg)/体重(g)。
1.5.2 血清相关指标
1.5.3 肠道组织形态
1.5.4 盲肠微生物群落
1.6 数据统计分析
2 结果与分析
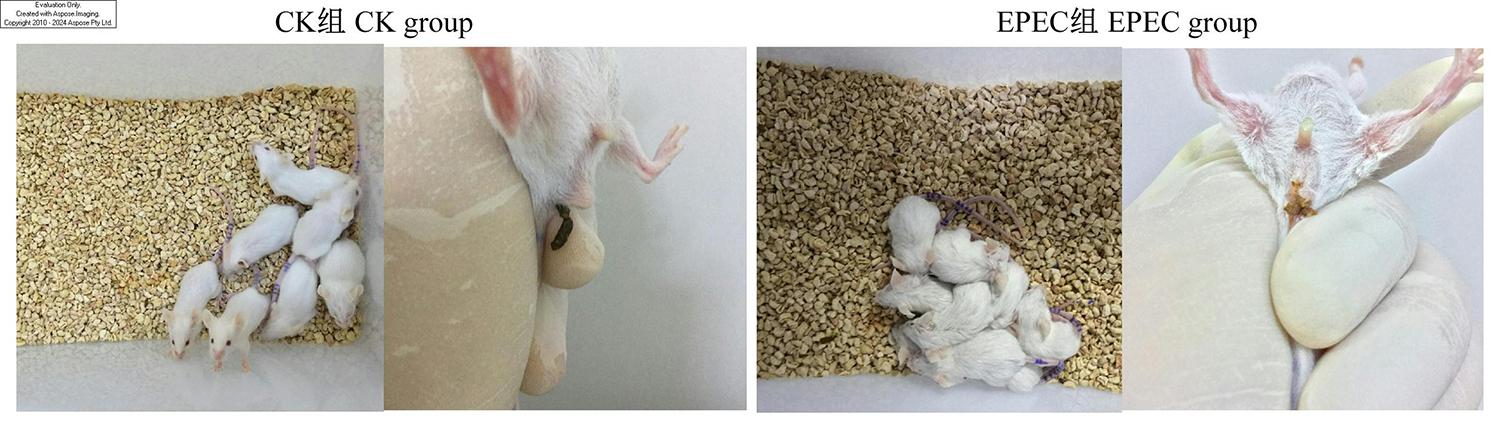
2.1 EPEC感染对小鼠临床症状和腹泻评分的影响
2.2 EPEC感染对小鼠体重的影响
表1 EPEC感染对小鼠腹泻评分的影响Table 1 Effects of EPEC infection on diarrhea score of mice |
| 项目 Items | CK组 CK group | EPEC组 EPEC group | t值 t-value | P值 P-value |
|---|---|---|---|---|
| 感染后第1天 Day 1 post-infection | 0.00±0.00 | 1.54±0.21 | -22.985 | 0.006 |
| 感染后第2天 Day 2 post-infection | 0.00±0.00 | 1.68±0.15 | -34.293 | <0.001 |
| 感染后第3天 Day 3 post-infection | 0.00±0.00 | 2.14±0.32 | -21.120 | <0.001 |
表2 EPEC感染对小鼠体重的影响Table 2 Effects of EPEC infection on body weight of mice |
| 项目 Items | CK组 CK group | EPEC组 EPEC group | t值 t-value | P值 P-value |
|---|---|---|---|---|
| 体重 Body weight/g | ||||
| 第0天 Day 0 | 11.91±0.80 | 11.71±0.39 | 0.453 | 0.666 |
| 第5天 Day 5 | 12.46±0.89 | 12.03±0.26 | 0.915 | 0.395 |
| 第6天 Day 6 | 12.97±0.94 | 11.56±0.32 | 2.827 | 0.030 |
| 第7天 Day 7 | 13.49±0.98 | 10.91±0.16 | 5.195 | 0.002 |
| 第8天 Day 8 | 13.77±0.97 | 10.94±0.25 | 5.611 | 0.001 |
| 体重变化率 Body weight change rate/% | ||||
| 感染后第1天 Day 1 post-infection | 4.07±0.16 | -3.89±0.68 | 22.679 | <0.001 |
| 感染后第2天 Day 2 post-infection | 8.24±0.10 | -9.33±0.83 | 41.815 | <0.001 |
| 感染后第3天 Day 3 post-infection | 10.52±0.33 | -9.11±1.13 | 33.149 | <0.001 |
2.3 EPEC感染对小鼠肠道组织形态及通透性的影响
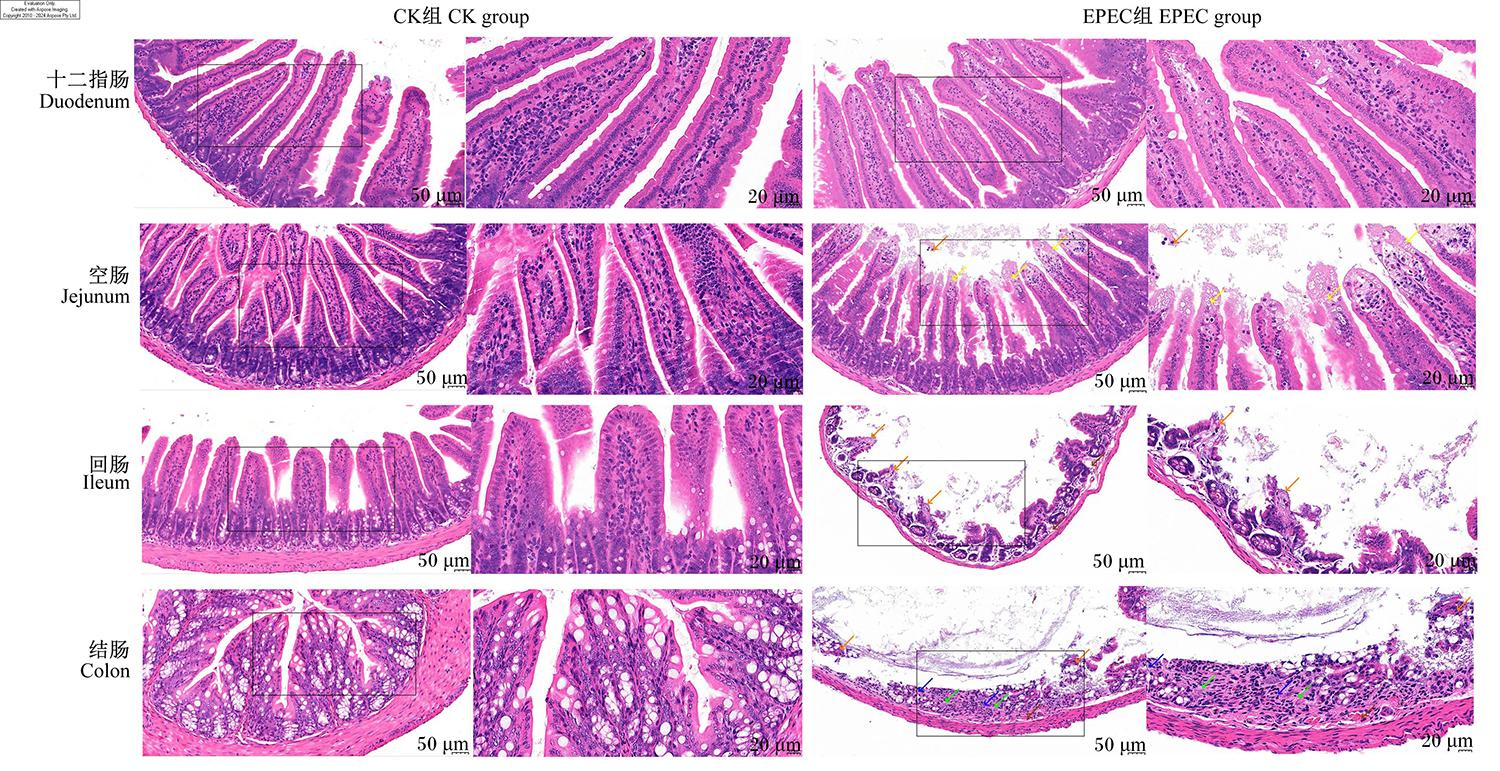
图3 小鼠肠道组织切片HE染色代表性图片橙色箭头:上皮细胞脱落;黄色箭头:上皮细胞坏死;绿色箭头:结缔组织增生;蓝色箭头:淋巴细胞浸润;棕色箭头:血管扩张/淤血。黑色方框表示放大视野位置。 Fig.3 Representative photographs of HE staining of intestinal tissue sections of mice Orange arrows: epithelial cell shedding; yellow arrows: epithelial cell necrosis; green arrows: connective tissue hyperplasia; blue arrows: lymphocyte infiltration; brown arrows: vascular dilation/congestion. The black box indicated the position of magnified field of view. |
表3 EPEC感染对小鼠肠道组织形态的影响Table 3 Effects of EPEC infection on intestinal histomorphology of mice |
| 项目 Items | CK组 CK group | EPEC组 EPEC group | t值 t-value | P值 P-value | |
|---|---|---|---|---|---|
| 十二指肠 Duodenum | |||||
| 绒毛高度 VH/μm | 431.22±57.83 | 448.83±11.20 | -0.598 | 0.572 | |
| 隐窝深度 CD/μm | 91.33±13.79 | 98.30±4.97 | -0.951 | 0.378 | |
| 绒隐比 V/C | 4.75±0.47 | 4.58±0.32 | 0.604 | 0.568 | |
| 空肠 Jejunum | |||||
| 绒毛高度 VH/μm | 326.58±8.47 | 268.01±6.73 | 12.090 | <0.001 | |
| 隐窝深度 CD/μm | 87.59±7.99 | 84.78±4.60 | 0.680 | 0.516 | |
| 绒隐比 V/C | 3.75±0.29 | 3.17±0.15 | 3.978 | 0.004 | |
| 回肠 Ileum | |||||
| 绒毛高度 VH/μm | 212.63±4.74 | 108.78±2.32 | 44.040 | <0.001 | |
| 隐窝深度 CD/μm | 85.68±9.57 | 59.21±8.84 | 4.540 | 0.002 | |
| 绒隐比 V/C | 2.50±0.23 | 1.87±0.24 | 4.130 | 0.003 | |
| 结肠 Colon | |||||
| 隐窝深度 CD/μm | 176.86±8.59 | 96.90±6.32 | 16.759 | <0.001 | |
表4 EPEC感染对小鼠血清肠道通透性指标的影响Table 4 Effects of EPEC infection on serum intestinal permeability indices of mice |
| 项目 Items | CK组 CK group | EPEC组 EPEC group | t值 t-value | P值 P-value |
|---|---|---|---|---|
| 连蛋白 Zonulin/(μg/mL) | 3 492.95±350.05 | 5 395.50±270.29 | -9.619 | <0.001 |
| D-乳酸 D-LA/(μmol/mL) | 0.83±0.09 | 1.20±0.08 | -6.802 | <0.001 |
2.4 EPEC感染对小鼠氧化应激和免疫功能的影响
表5 EPEC感染对小鼠氧化应激和免疫功能的影响Table 5 Effects of EPEC infection on oxidative stress and immune function of mice |
| 项目 Items | CK组 CK group | EPEC组 EPEC group | t值 t-value | P值 P-value |
|---|---|---|---|---|
| 氧化应激指标 Oxidative stress indices | ||||
| 总超氧化物歧化酶 T-SOD/(U/mL) | 277.91±10.08 | 208.63±8.50 | 3.303 | 0.016 |
| 丙二醛 MDA/(μmol/L) | 8.77±1.07 | 13.41±0.96 | -6.434 | 0.001 |
| 总抗氧化能力 T-AOC/(mmol/L) | 1.35±0.07 | 1.09±0.04 | 6.296 | 0.001 |
| 免疫相关指标 Immune-related indices | ||||
| 免疫球蛋白A IgA/(μg/mL) | 1 039.94±92.10 | 1 479.18±128.36 | -6.217 | <0.001 |
| 免疫球蛋白M IgM/(μg/mL) | 114.77±10.86 | 146.45±18.54 | -3.297 | 0.011 |
| 免疫球蛋白G IgG/(μg/mL) | 336.74±28.61 | 383.94±43.54 | -2.026 | 0.077 |
| 肿瘤坏死因子-α TNF-α/(pg/mL) | 34.06±2.35 | 46.70±2.88 | -7.586 | <0.001 |
| 脾脏指数 Spleen index/% | 0.37±0.04 | 0.47±0.02 | -4.269 | 0.003 |
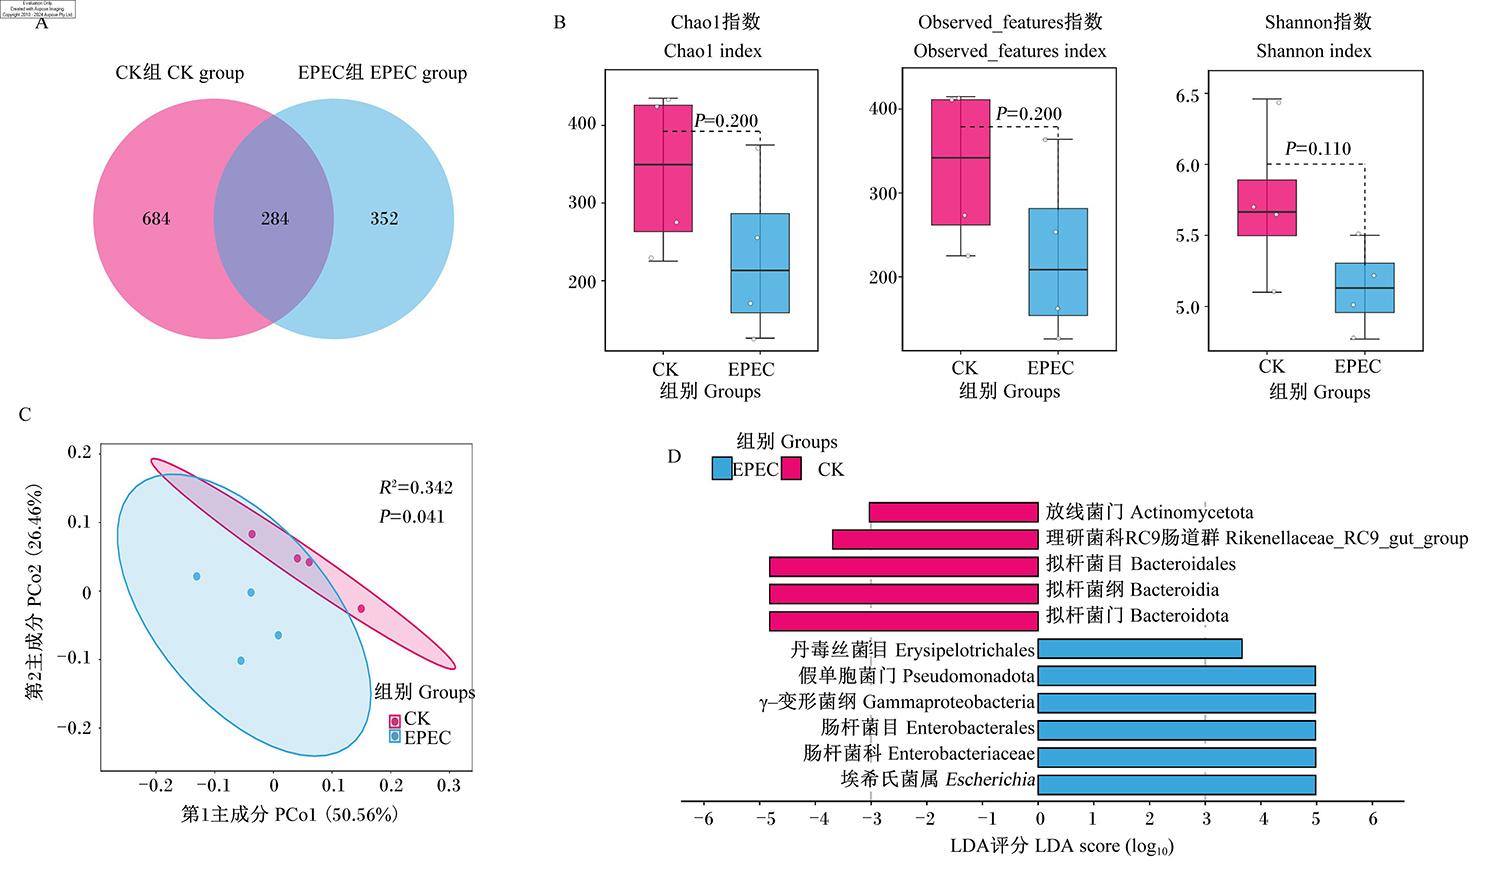
2.5 EPEC感染对小鼠盲肠微生物群落结构的影响
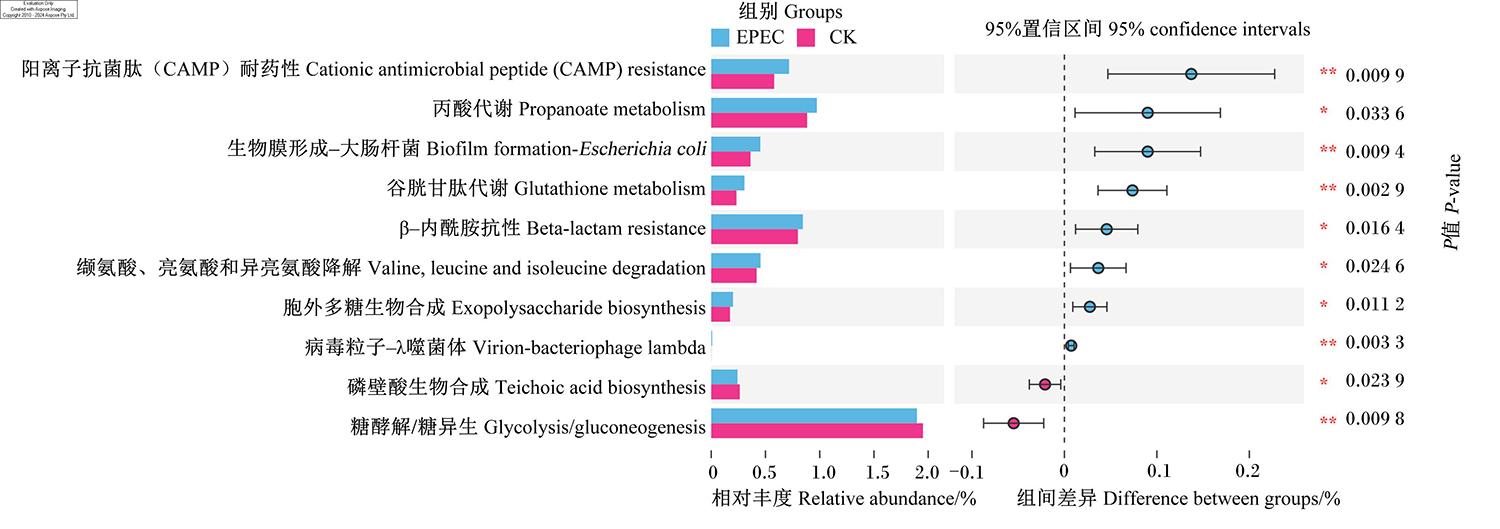
2.6 EPEC感染对小鼠盲肠微生物群落功能的影响
2.7 小鼠盲肠差异菌群与表型指标的相关性分析
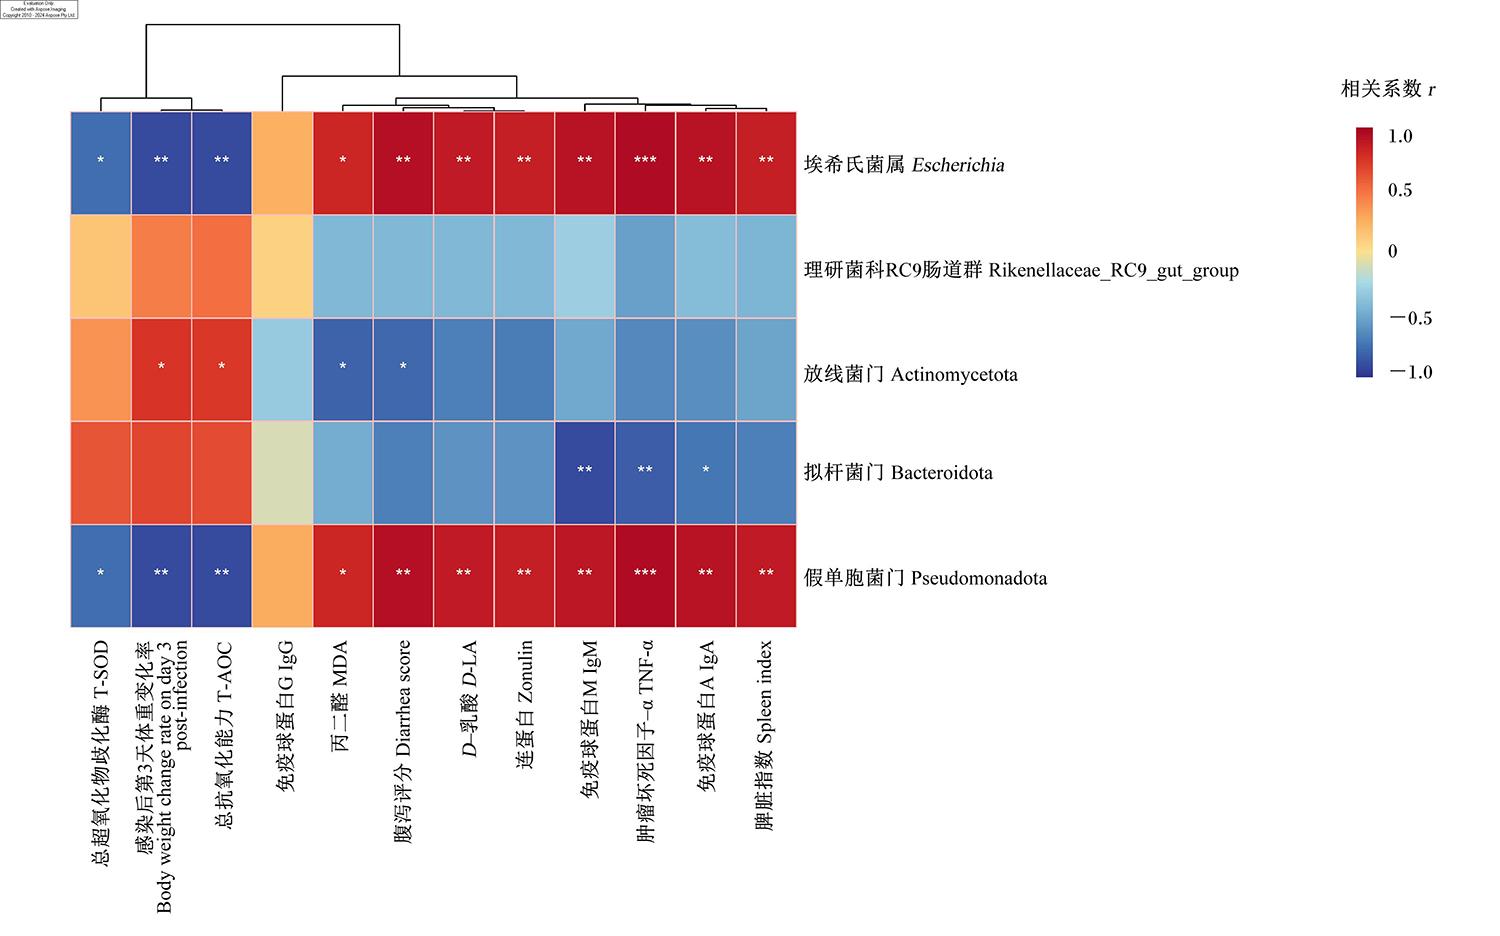


图6 小鼠盲肠差异菌群与表型指标的相关性热图*表示显著相关(P<0.05),**(P<0.01)和***(P<0.001)表示极显著相关。 Fig.6 Correlation heatmap of cecal differential microbiota and phenotypic indices of mice * indicated significant correlation (P<0.05), and ** (P<0.01) and *** (P<0.001) indicated extremely significant correlation. |