1 材料与方法
1.1 主要材料与试剂
1.2 主要仪器与设备
1.3 试验方法
1.3.1 桑叶粉的制备
1.3.2 桑叶蛋白的提取
1.3.3 桑叶蛋白含量的测定
1.3.4 桑叶蛋白提取工艺的单因素试验
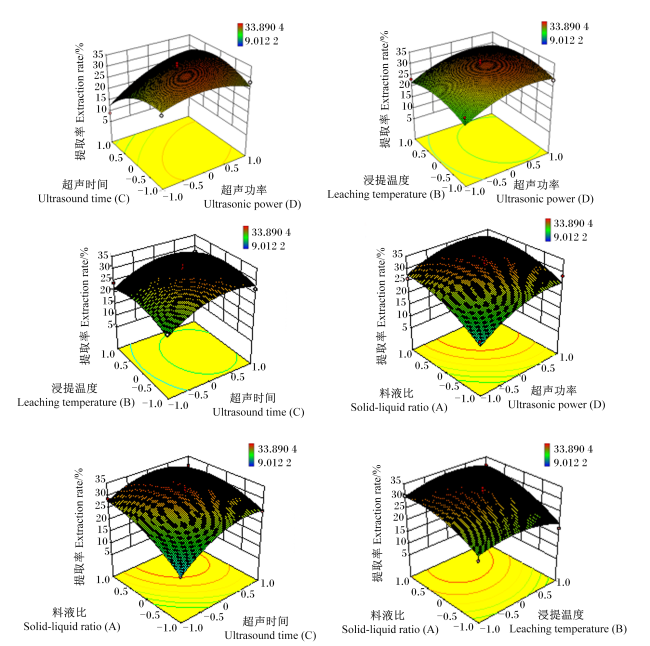
1.3.5 桑叶蛋白提取工艺的响应面优化
表1 响应面分析试验因素及水平Table 1 Factors and levels of response surface methodology |
| 水平 Levels | 因素Factors | |||
|---|---|---|---|---|
| 料液比 Solid-liquid ratio (A)/(g/mL) | 浸提温度 Leaching temperature (B)/℃ | 超声时间 Ultrasound time (C)/min | 超声功率 Ultrasonic power (D)/W | |
| -1 | 1∶15 | 20 | 4 | 195 |
| 0 | 1∶20 | 30 | 5 | 260 |
| 1 | 1∶25 | 40 | 6 | 325 |
1.3.6 桑叶蛋白的抗氧化活性研究
1.3.6.1 ABTS自由基清除率的测定
1.3.6.2 DPPH自由基清除率的测定
1.3.6.3 羟基自由基清除率的测定
1.3.6.4 还原力的测定
1.4 数据处理与分析
2 结果与分析
2.1 桑叶蛋白提取单因素试验
2.1.1 浸提温度对桑叶蛋白提取率的影响
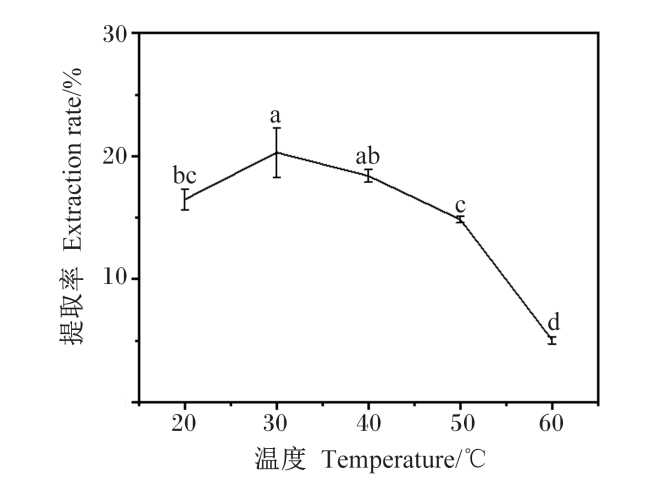
图1 浸提温度对桑叶蛋白提取率的影响数据点标相同小写字母表示差异不显著(P>0.05),不同小写字母表示差异显著(P<0.05)。图2至图6同。 Fig.1 Effects of leaching temperature on extraction rate of MLP Data point labeled with the same lowercase letters indicated a non-significant difference (P>0.05), and with different lowercase letters indicated a significant difference (P<0.05). The same as Fig.2 to Fig.6. |
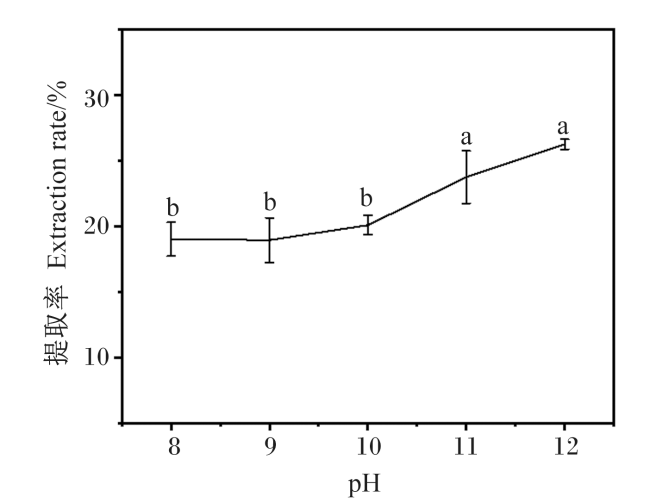
2.1.2 浸提液pH对桑叶蛋白提取率的影响
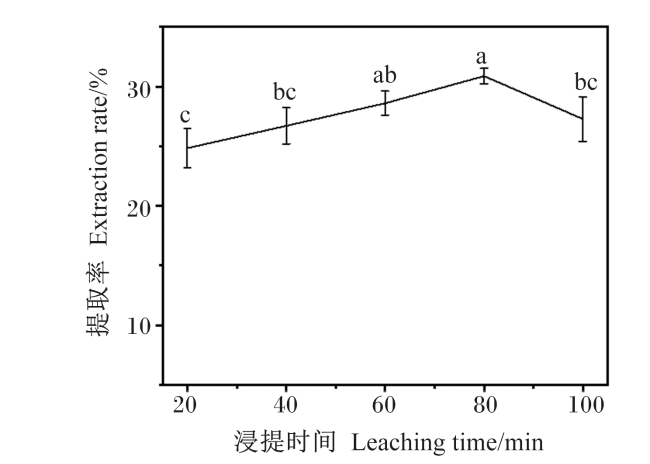
2.1.3 浸提时间对桑叶蛋白提取率的影响
2.1.4 料液比对桑叶蛋白提取率的影响
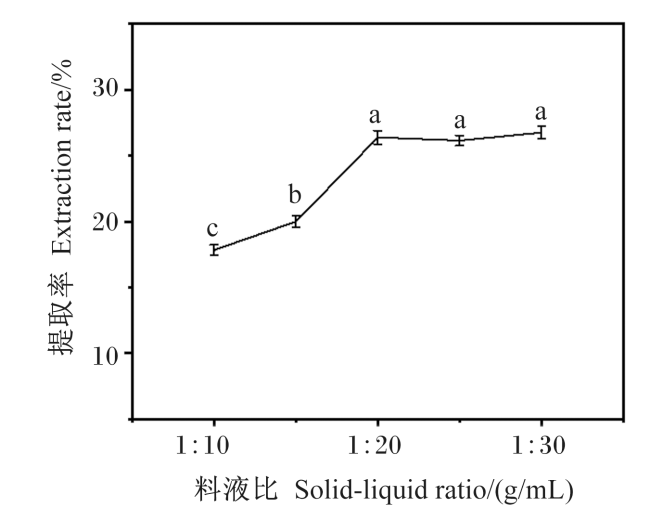
2.1.5 超声时间对桑叶蛋白提取率的影响
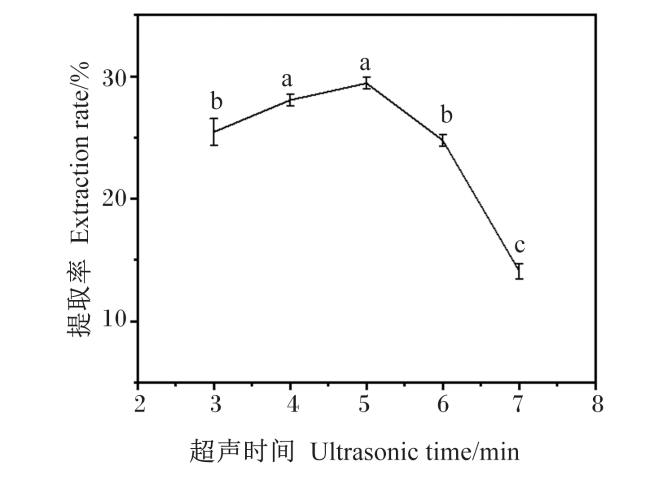
2.1.6 超声功率对桑叶蛋白提取率的影响
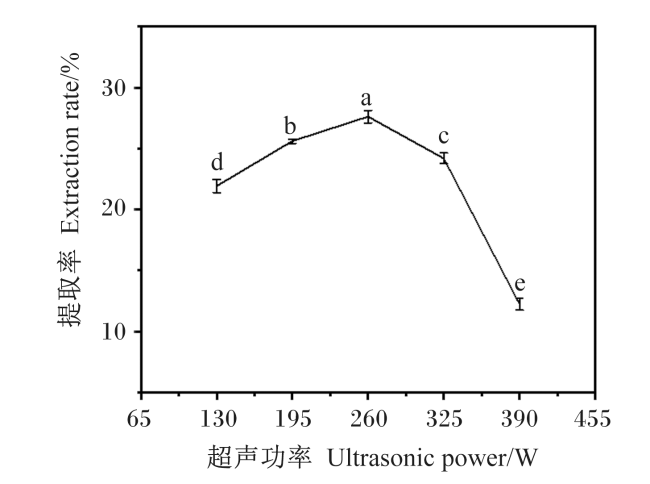
2.2 桑叶蛋白提取率的响应面优化
2.2.1 试验结果与方差分析
表2 桑叶蛋白提取响应面设计方案及结果Table 2 Response surface design scheme and results of MLP extraction |
| 编号 No. | 因素Factors | 桑叶蛋白提取率 Extraction rate of MLP/% | |||
|---|---|---|---|---|---|
| 料液比 Solid-liquid ratio (A) | 浸提温度 Leaching temperature (B) | 超声时间 Ultrasound time (C) | 超声功率 Ultrasonic power (D) | ||
| 1 | -1 | -1 | 0 | 0 | 18.174 7 |
| 2 | 1 | -1 | 0 | 0 | 31.458 6 |
| 3 | -1 | 1 | 0 | 0 | 20.421 3 |
| 4 | 1 | 1 | 0 | 0 | 30.099 4 |
| 5 | 0 | 0 | -1 | -1 | 28.310 2 |
| 6 | 0 | 0 | 1 | -1 | 27.404 8 |
| 7 | 0 | 0 | -1 | 1 | 26.341 2 |
| 8 | 0 | 0 | 1 | 1 | 9.012 1 |
| 9 | -1 | 0 | 0 | -1 | 28.541 0 |
| 10 | 1 | 0 | 0 | -1 | 31.489 7 |
| 11 | -1 | 0 | 0 | 1 | 17.370 6 |
| 12 | 1 | 0 | 0 | 1 | 26.073 1 |
| 13 | 0 | -1 | -1 | 0 | 26.769 2 |
| 14 | 0 | 1 | -1 | 0 | 27.614 9 |
| 15 | 0 | -1 | 1 | 0 | 21.028 3 |
| 16 | 0 | 1 | 1 | 0 | 24.138 9 |
| 17 | -1 | 0 | -1 | 0 | 25.139 2 |
| 18 | 1 | 0 | -1 | 0 | 30.844 0 |
| 19 | -1 | 0 | 1 | 0 | 14.107 1 |
| 20 | 1 | 0 | 1 | 0 | 28.795 3 |
| 21 | 0 | -1 | 0 | -1 | 28.006 6 |
| 22 | 0 | 1 | 0 | -1 | 26.460 5 |
| 23 | 0 | -1 | 0 | 1 | 24.476 0 |
| 24 | 0 | 1 | 0 | 1 | 23.274 9 |
| 25 | 0 | 0 | 0 | 0 | 30.392 3 |
| 26 | 0 | 0 | 0 | 0 | 33.890 4 |
| 27 | 0 | 0 | 0 | 0 | 32.259 5 |
| 28 | 0 | 0 | 0 | 0 | 29.392 6 |
| 29 | 0 | 0 | 0 | 0 | 32.869 9 |
表3 回归模型方差分析Table 3 ANOVA of regression model |
| 方差来源 Source of variance | 平方和 Sum of square | 自由度 DF | 均方 Mean square | F值 F-value | P值 P-value | 显著性 Significance | |||||||
|---|---|---|---|---|---|---|---|---|---|---|---|---|---|
| 模型Model | 862.52 | 14 | 61.61 | 10.55 | <0.000 1 | ** | |||||||
| A | 252.14 | 1 | 252.14 | 43.16 | <0.000 1 | ** | |||||||
| B | 0.37 | 1 | 0.37 | 0.06 | 0.805 9 | ||||||||
| C | 136.91 | 1 | 136.91 | 23.43 | 0.000 3 | ** | |||||||
| D | 158.89 | 1 | 158.89 | 27.20 | 0.000 1 | ** | |||||||
| AB | 3.25 | 1 | 3.25 | 0.56 | 0.468 1 | ||||||||
| AC | 20.18 | 1 | 20.18 | 3.45 | 0.084 3 | ||||||||
| AD | 8.28 | 1 | 8.28 | 1.42 | 0.253 7 | ||||||||
| BC | 1.28 | 1 | 1.28 | 0.22 | 0.646 6 | ||||||||
| BD | 0.03 | 1 | 0.03 | 5.09×10⁻³ | 0.944 1 | ||||||||
| CD | 67.43 | 1 | 67.43 | 11.54 | 0.004 3 | ** | |||||||
| A2 | 53.52 | 1 | 53.52 | 9.16 | 0.009 1 | ** | |||||||
| B2 | 56.31 | 1 | 56.31 | 9.64 | 0.007 8 | ** | |||||||
| C2 | 131.27 | 1 | 131.27 | 22.47 | 0.000 3 | ** | |||||||
| D2 | 83.68 | 1 | 83.68 | 14.32 | 0.002 0 | ** | |||||||
| 残差Residual | 81.79 | 14 | 5.84 | ||||||||||
| 失拟项Lack of fit | 68.29 | 10 | 6.83 | 2.02 | 0.259 2 | ||||||||
| 误差Error | 13.50 | 4 | 3.37 | ||||||||||
| 总和Sum | 944.30 | 28 |
A:料液比 solid-liquid ratio;B:浸提温度 leaching temperature;C:超声时间 ultrasound time;D:超声功率 ultrasonic power。 **表示差异极显著(P<0.01)。** indicated extremely significant differences (P<0.01). |
2.2.2 各因素间交互作用分析
2.2.3 最佳提取工艺的确定与验证
2.3 桑叶蛋白的抗氧化活性
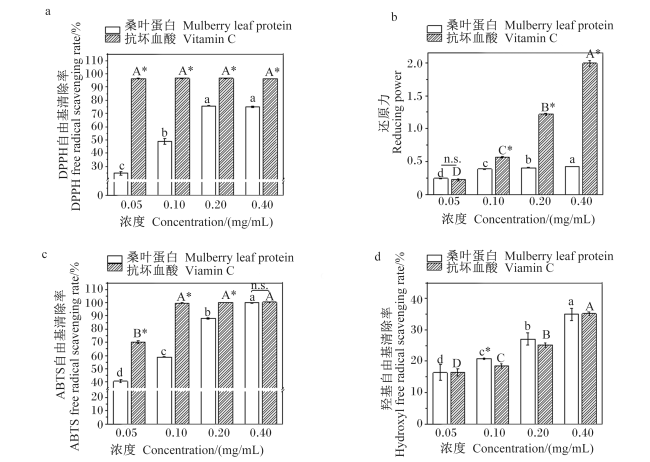
图7 桑叶蛋白体外抗氧化活性试验结果数据柱标记大写字母和小写字母分别代表同一种样品不同浓度间的差异性比较,不同字母代表差异显著(P<0.05);*表示同一浓度下不同样品间的差异性比较,*代表差异显著(P<0.05);n.s.表示无显著差异(P>0.05)。 Fig.7 Results of in vitro antioxidant activity assay of MLP Data column labeled with uppercase and lowercase letters represented comparisons of differences between different concentrations of the same sample, respectively, and different letters represented significant difference (P<0.05); * denoted comparisons of differences between different samples at the same concentration, and * represented significant difference (P<0.05); n.s. mean no significant difference (P>0.05). |