

1 材料与方法
1.1 TMR样品的采集
1.2 光谱采集
1.3 淀粉含量测定
1.4 光谱预处理与预测模型建立
表1 定标集和验证集中淀粉含量的统计描述Table 1 Statistical description of starch content in calibration set and validation set |
| 数据集 Databases | 样品数量 Number of samples | 平均值 Mean/% | 标准差 SD/% | 最小值 Min/% | 最大值 Max/% |
|---|---|---|---|---|---|
| 定标集Calibration set | 658 | 26.51 | 3.33 | 11.85 | 34.19 |
| 验证集Validation set | 120 | 26.22 | 3.75 | 11.79 | 32.53 |
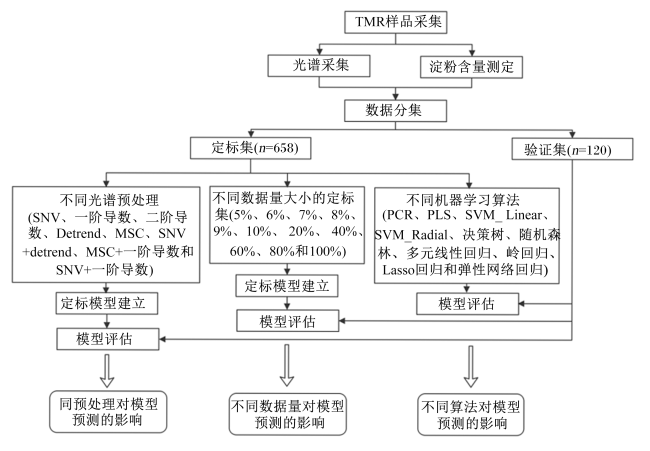
图1 TMR淀粉含量NIRS预测模型的构建与评估流程图TMR:全混合日粮 total mixed ration;SNV:标准正态变量变换 standard normal variant;Detrend:去趋势;MSC:多元散射校正 multiplicative scatter correction;PCR:主成分回归 principal component regression;PLS:偏最小二乘 partial least squares;SVM_Linear:线性核函数支持向量机 support vector machine with linear kernel;SVM_Radial 径向基核函数支持向量机 support vector machine with radial kernel。 Fig.1 Flowchart of construction and evaluation of TMR starch content NIRS prediction model |
1.5 模型内部验证和外部评估
2 结果
2.1 不同光谱预处理方法对TMR淀粉含量NIRS预测模型的影响
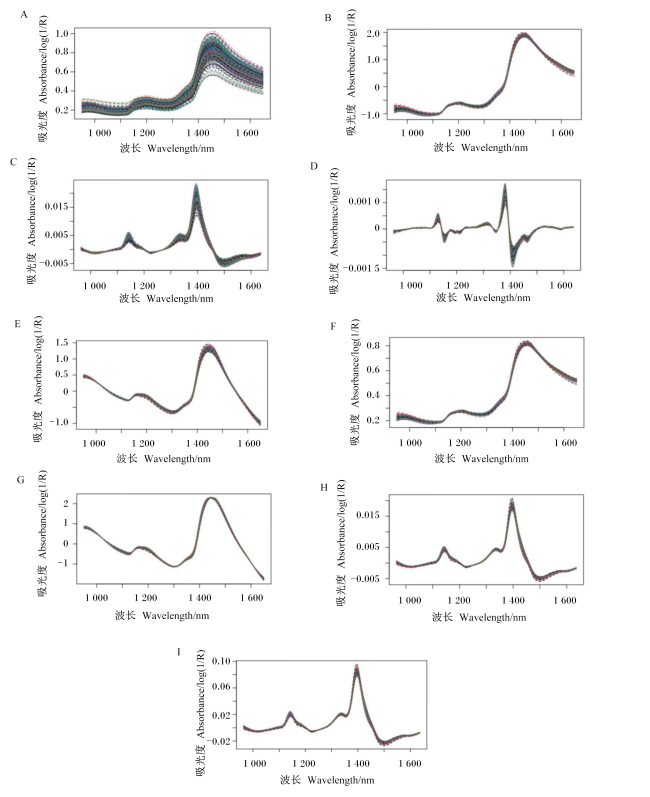
图2 TMR样品的近红外原始光谱与预处理后的光谱A:原始光谱 raw spectra;B:SNV处理后的光谱 SNV-processed spectra;C:一阶导数处理后的光谱 1st derivative-processed spectra;D:二阶导数处理后的光谱 2nd derivative-processed spectra;E:Detrend处理后的光谱 Detrend-processed spectra;F:MSC处理后的光谱 MSC-processed spectra;G:SNV+Detrend处理后的光谱 SNV+Detrend-processed spectra;H:MSC+一阶导数处理后的光谱 MSC+1st derivative-processed spectra;I:SNV+一阶导数处理后的光谱SNV+1st derivative-processed spectra。 Fig.2 Raw and preprocessed near-infrared spectra of TMR samples |
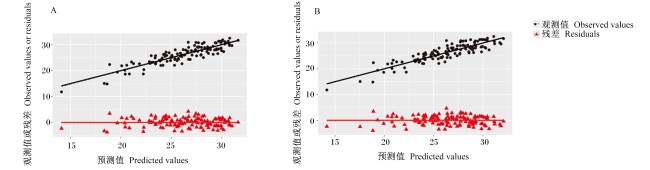
图3 基于近红外原始光谱建立的PCR和PLS模型的评估A:PCR模型 PCR model;B:PLS模型 PLS model。 Fig.3 Evaluation of PCR and PLS models established based on raw near-infrared spectra |
表2 不同预处理方法下进行PCR建模的内部验证与外部评估Table 2 Internal validation and external evaluation of PCR modeling under different preprocessing methods |
| 项目 Items | 原始光谱 Raw spectra | 标准正态 变量变换 SNV | 一阶导数 1st derivative | 二阶导数 2nd derivative | 去趋势 Detrend | 多元散 射校正 MSC | 标准正态变量 变换+去趋势 SNV+ Detrend | 多元散射校 正+一阶导数 MSC+1st derivative | 标准正态变量 变换+一阶导数 SNV+1st derivative |
|---|---|---|---|---|---|---|---|---|---|
| 内部验证Internal validation | |||||||||
| 定标决定系数 | 0.78 | 0.77 | 0.77 | 0.76 | 0.76 | 0.77 | 0.73 | 0.78 | 0.76 |
| 定标标准偏差SEC | 1.56 | 1.59 | 1.59 | 1.64 | 1.62 | 1.60 | 1.72 | 1.56 | 1.64 |
| 交叉验证相关系数1-VR | 0.61 | 0.61 | 0.60 | 0.57 | 0.61 | 0.61 | 0.56 | 0.61 | 0.61 |
| 交叉验证标准误差SECV | 2.08 | 2.08 | 2.11 | 2.17 | 2.08 | 2.07 | 2.22 | 2.08 | 2.08 |
| 外部评估External evaluation | |||||||||
| 验证集样品数量 Number of samples in validation set | 120 | 120 | 120 | 120 | 120 | 120 | 120 | 120 | 120 |
| 观测平均值Observed mean/% | 26.22 | 26.22 | 26.22 | 26.22 | 26.22 | 26.22 | 26.22 | 26.22 | 26.22 |
| 预测平均值Predicted mean/% | 26.21 | 26.18 | 26.23 | 26.19 | 26.20 | 27.44 | 26.12 | 25.82 | 26.15 |
| 预测均方根误差RMSPE/% | 6.53 | 6.81 | 6.62 | 6.90 | 7.14 | 8.21 | 7.21 | 6.88 | 6.74 |
| 均值误差Mean bias/% | 0.008 0 | 0.060 0 | 0.002 0 | 0.040 0 | 0.010 0 | 31.720 0 | 0.319 5 | 5.060 0 | 0.190 0 |
| 斜率误差Slope bias/% | 0.070 0 | 0.430 0 | 0.002 0 | 0.060 0 | 0.780 0 | 0.130 0 | 0.160 5 | 0.530 0 | 1.190 0 |
| 随机误差Random bias/% | 99.922 0 | 99.510 0 | 99.996 0 | 99.900 0 | 99.210 0 | 68.150 0 | 99.520 0 | 94.410 0 | 98.620 0 |
| 一致性相关系数CCC | 0.88 | 0.88 | 0.88 | 0.87 | 0.86 | 0.83 | 0.86 | 0.87 | 0.88 |
表3 不同预处理方法下进行PLS建模的内部验证与外部评估Table 3 Internal validation and external evaluation of PLS modeling under different preprocessing methods |
| 项目 Items | 原始光谱 Raw spectra | 标准正态 变量变换 SNV | 一阶导数 1st derivative | 二阶导数 2nd derivative | 去趋势 Detrend | 多元散 射校正 MSC | 标准正态变量 变换+去趋势 SNV+ Detrend | 多元散射校 正+一阶导数 MSC+1st derivative | 标准正态变量 变换+一阶导数 SNV+1st derivative | |||||||||
|---|---|---|---|---|---|---|---|---|---|---|---|---|---|---|---|---|---|---|
| 内部验证Internal validation | ||||||||||||||||||
| 定标决定系数 | 0.79 | 0.77 | 0.78 | 0.76 | 0.78 | 0.77 | 0.77 | 0.79 | 0.76 | |||||||||
| 定标标准偏差SEC | 1.54 | 1.59 | 1.55 | 1.63 | 1.57 | 1.60 | 1.61 | 1.53 | 1.63 | |||||||||
| 交叉验证相关系数1-VR | 0.49 | 0.51 | 0.58 | 0.58 | 0.52 | 0.50 | 0.52 | 0.60 | 0.60 | |||||||||
| 交叉验证标准误差SECV | 2.37 | 2.33 | 2.15 | 2.17 | 2.30 | 2.35 | 2.31 | 2.10 | 2.10 | |||||||||
| 外部评估External evaluation | ||||||||||||||||||
| 验证集样品数量 Number of samples in validation set | 120 | 120 | 120 | 120 | 120 | 120 | 120 | 120 | 120 | |||||||||
| 观测平均值Observed mean/% | 26.22 | 26.22 | 26.22 | 26.22 | 26.22 | 26.22 | 26.22 | 26.22 | 26.22 | |||||||||
| 预测平均值Predicted mean/% | 26.24 | 26.23 | 26.22 | 26.18 | 26.21 | 28.03 | 26.17 | 25.74 | 26.14 | |||||||||
| 预测均方根误差RMSPE/% | 6.55 | 6.67 | 6.81 | 6.86 | 7.15 | 9.54 | 7.17 | 7.00 | 6.77 | |||||||||
| 均值误差Mean bias/% | 0.013 0 | 0.002 0 | 0.000 6 | 0.070 0 | 0.009 0 | 52.280 0 | 0.075 2 | 6.820 0 | 0.210 0 | |||||||||
| 斜率误差Slope bias/% | 0.000 3 | 0.310 0 | 0.004 0 | 0.130 0 | 1.400 0 | 0.010 0 | 0.677 8 | 0.250 0 | 0.550 0 | |||||||||
| 随机误差Random bias/% | 99.986 7 | 99.688 0 | 99.995 4 | 99.800 0 | 98.591 0 | 47.710 0 | 99.247 0 | 92.930 0 | 99.240 0 | |||||||||
| 一致性相关系数CCC | 0.88 | 0.88 | 0.87 | 0.87 | 0.86 | 0.78 | 0.86 | 0.87 | 0.88 | |||||||||
2.2 不同定标集数据量对TMR淀粉含量NIRS预测模型的影响
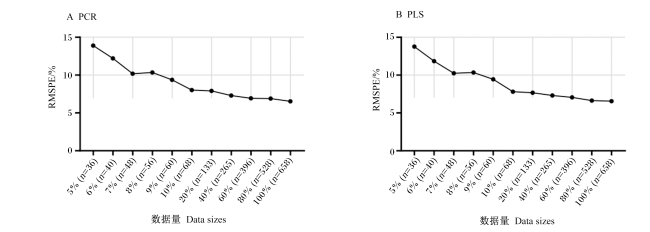


图4 基于不同定标集数据量建立的PCR和PLS模型的RMSPEPCR:主成分回归 principal component regression;PLS:偏最小二乘 partial least squares;RMSPE:预测均方根误差 root mean squared prediction error。 Fig.4 RMSPE of PCR and PLS models established based on different calibration set data sizes |
表4 基于不同定标集数据量进行PCR建模的外部评估Table 4 External validation PCR modeling based on different calibration set data sizes |
| 项目 Items | 数据量Data sizes | |||||||||||
|---|---|---|---|---|---|---|---|---|---|---|---|---|
| 5% (n=36) | 6% (n=40) | 7% (n=48) | 8% (n=56) | 9% (n=60) | 10% (n=68) | 20% (n=133) | 40% (n=265) | 60% (n=396) | 80% (n=528) | 100% (n=658) | ||
| 验证集样品数量 Number of samples in validation set | 120 | 120 | 120 | 120 | 120 | 120 | 120 | 120 | 120 | 120 | 120 | |
| 观测平均值Observed mean | 26.22 | 26.22 | 26.22 | 26.22 | 26.22 | 26.22 | 26.22 | 26.22 | 26.22 | 26.22 | 26.22 | |
| 预测平均值Predicted mean | 26.60 | 26.36 | 26.05 | 27.04 | 26.76 | 26.41 | 26.32 | 26.15 | 26.27 | 26.15 | 26.21 | |
| 预测均方根误差RMSPE/% | 13.89 | 12.21 | 10.18 | 10.35 | 9.37 | 8.02 | 7.90 | 7.29 | 6.93 | 6.89 | 6.53 | |
| 均值误差Mean bias/% | 1.046 9 | 0.178 4 | 0.429 8 | 8.959 3 | 4.799 4 | 0.781 0 | 0.231 6 | 0.139 9 | 0.057 6 | 0.178 1 | 0.008 3 | |
| 斜率误差Slope bias/% | 7.524 2 | 5.061 6 | 2.635 2 | 4.812 0 | 8.859 8 | 3.098 2 | 0.142 6 | 0.304 4 | 0.061 9 | 0.296 9 | 0.069 6 | |
| 随机误差Random bias/% | 91.428 9 | 94.760 0 | 96.935 0 | 86.228 7 | 86.340 8 | 96.120 8 | 99.625 8 | 99.555 7 | 99.880 5 | 99.525 0 | 99.922 1 | |
| 一致性相关系数CCC | 0.32 | 0.53 | 0.70 | 0.72 | 0.78 | 0.83 | 0.82 | 0.85 | 0.86 | 0.86 | 0.88 | |
表5 基于不同定标集数据量进行PLS建模的外部评估Table 5 External validation PLS modeling based on different calibration set data sizes |
| 项目 Items | 数据量Data sizes | |||||||||||
|---|---|---|---|---|---|---|---|---|---|---|---|---|
| 5% (n=36) | 6% (n=40) | 7% (n=48) | 8% (n=56) | 9% (n=60) | 10% (n=68) | 20% (n=133) | 40% (n=265) | 60% (n=396) | 80% (n=528) | 100% (n=658) | ||
| 验证集样品数量 Number of samples in validation set | 120 | 120 | 120 | 120 | 120 | 120 | 120 | 120 | 120 | 120 | 120 | |
| 观测平均值Observed mean | 26.22 | 26.22 | 26.22 | 26.22 | 26.22 | 26.22 | 26.22 | 26.22 | 26.22 | 26.22 | 26.22 | |
| 预测平均值Predicted mean | 26.52 | 26.28 | 26.14 | 27.07 | 26.78 | 26.35 | 26.35 | 26.07 | 26.22 | 26.18 | 26.24 | |
| 预测均方根误差RMSPE/% | 13.77 | 11.85 | 10.24 | 10.34 | 9.44 | 7.80 | 7.67 | 7.31 | 7.05 | 6.63 | 6.55 | |
| 均值误差Mean bias/% | 0.667 3 | 0.029 1 | 0.097 9 | 9.764 0 | 5.045 8 | 0.377 7 | 0.408 9 | 0.599 4 | 0.000 8 | 0.053 9 | 0.012 8 | |
| 斜率误差Slope bias/% | 7.284 6 | 3.095 7 | 3.820 0 | 4.353 9 | 8.921 3 | 1.169 8 | 0.033 9 | 0.090 0 | 0.111 2 | 0.010 0 | 0.000 3 | |
| 随机误差Random bias/% | 92.048 1 | 96.875 2 | 96.082 1 | 85.882 1 | 86.032 9 | 98.452 5 | 99.557 2 | 99.310 6 | 99.888 0 | 99.936 1 | 99.986 9 | |
| 一致性相关系数CCC | 0.34 | 0.54 | 0.70 | 0.71 | 0.78 | 0.83 | 0.83 | 0.85 | 0.86 | 0.88 | 0.88 | |
2.3 不同机器学习算法对TMR淀粉含量NIRS预测模型的影响
表6 基于不同机器学习算法构建的TMR淀粉含量预测模型的外部评估Table 6 External model evaluation of TMR starch concentration prediction models based on different machine learning algorithms |
| 项目 Items | 主成分 回归 PCR | 偏最 小二乘 PLS | 线性核函 数支持 向量机 SVM_ Linear | 径向核 函数支 持向量机 SVM_ Radial | 决策树 Decision tree | 随机森林 Random forest | 多元线 性回归 MLR | 岭回归 Ridge regression | Lasso回归 Lasso regression | 弹性网 络回归 Elastic net regression |
|---|---|---|---|---|---|---|---|---|---|---|
| 验证集样品数量 Number of samples in validation set | 120 | 120 | 120 | 120 | 120 | 120 | 120 | 120 | 120 | 120 |
| 观测平均值Observed mean | 26.22 | 26.22 | 26.22 | 26.22 | 26.22 | 26.22 | 26.22 | 26.22 | 26.22 | 26.22 |
| 预测平均值Predicted mean | 26.21 | 26.24 | 26.57 | 26.72 | 26.35 | 26.53 | 26.38 | 26.37 | 26.20 | 26.24 |
| 预测均方根误差RMSPE/% | 6.53 | 6.55 | 11.17 | 13.55 | 14.49 | 13.51 | 9.05 | 12.33 | 8.38 | 9.74 |
| 均值误差Mean bias/% | 0.008 3 | 0.012 8 | 1.390 0 | 1.975 8 | 0.108 3 | 0.753 0 | 0.427 4 | 0.209 3 | 0.013 6 | 0.004 9 |
| 斜率误差Slope bias/% | 0.069 6 | 0.000 3 | 1.344 2 | 0.257 4 | 8.951 7 | 1.793 9 | 8.114 0 | 1.043 2 | 3.862 3 | 0.493 1 |
| 随机误差Random bias/% | 99.922 1 | 99.986 9 | 97.265 8 | 97.766 8 | 90.940 0 | 97.453 1 | 91.458 6 | 98.747 5 | 96.124 1 | 99.502 0 |
| 一致性相关系数CCC | 0.88 | 0.88 | 0.53 | 0.23 | 0.21 | 0.27 | 0.79 | 0.37 | 0.77 | 0.71 |